Analysis Before and After Diet – Change and Achievement
RJ0600066_10
- Last Update 07/07/2025
- File Size 8.5MB
- # of Slides 2
- File Format PPTX
- Slide Ratio 16:9
- Color
Keywords
- #Content-Based Slides
- #Design-Based Slides
- #Product/Service Introduction
- #Market and Competitor Analysis
- #Graph
- #Features
- #Customer Analysis
- #Other
- #Radar Chart Spider Chart
- #16:9
- #radial diagram PowerPoint
- #radial chart slide template
- #5-item comparison chart
- #before and after analysis slide
- #radial diagram slide download
About the Product
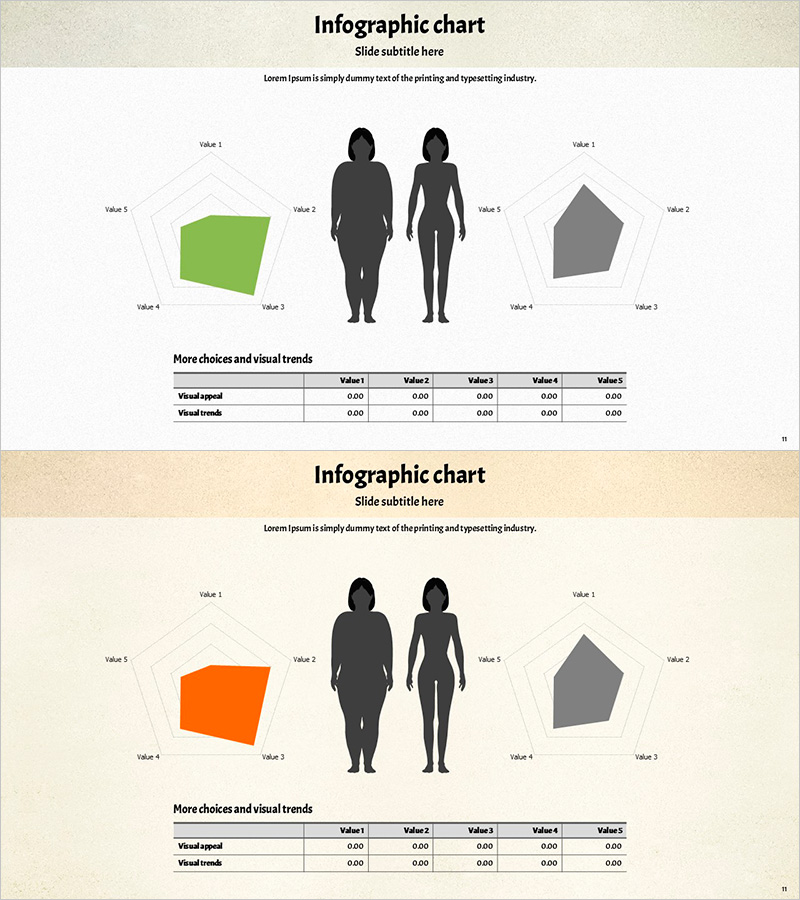
A radial diagram PowerPoint slide designed to visualize before-and-after diet transformation analysis. The layout features human silhouettes at the center with dual 5-axis radial charts positioned on both sides—lime green on the left and gray on the right—enabling side-by-side comparison of body metrics and performance indicators. A data table below provides quantitative details. This 2-slide deck is ideal for fitness professionals, nutritionists, and wellness coaches presenting measurable results in health and fitness presentations.
Usage Points
-
Main Usage
Compare multiple body metrics, fitness improvements, or health indicators across five dimensions using a radial chart format. Ideal for demonstrating quantifiable results in diet, exercise, and wellness programs where visual impact and data clarity are essential.
-
How to Use
Enter before-and-after data values (Value 1–5) into the left lime-green and right gray radial charts. The diagram automatically adjusts to reflect input changes. Customize the data table below with specific measurements, percentages, or performance metrics. All elements are fully editable in PowerPoint.
-
Recommended For
Fitness trainers, nutritionists, personal coaches, health consultants, wellness program directors, and fitness researchers presenting client progress, program effectiveness, or health transformation case studies to stakeholders and clients.
-
Slide Structure
2-slide template in 16:9 widescreen format. Each slide contains a central human silhouette (male and female variants) flanked by dual 5-axis radial charts in contrasting colors (lime green and gray). A comparison data table with 5 columns and 2 rows sits below. All shapes, text, and data fields are fully editable.
Related Products
-

Art and Science Radar Charts – Visual Data Analysis
#Market and Competitor Analysis #Diagram #Graph
-

Content-Based and Customer Analysis Presentation Template – Sleek Design with Clear Layouts
#Product/Service Introduction #Graph #Features
-

Business Insight Through Two Perspectives
#Product/Service Introduction #Market and Competitor Analysis #Diagram
-

Natural Environment Radar Chart – Emphasizing Vitality and Harmony
#Product/Service Introduction #Graph #Features
