Aerobic Exercise System Diagram – Strategies for Effective Outcomes
RJ0600066_15
- Last Update 07/07/2025
- File Size 8.9MB
- # of Slides 2
- File Format PPTX
- Slide Ratio 16:9
- Color
Keywords
- #Content-Based Slides
- #Design-Based Slides
- #Product/Service Introduction
- #Business Strategy
- #Diagram
- #Graph
- #Program Introduction
- #Achievements
- #Flow
- #Horizontal Bar
- #Linear Flow
- #Segmented Horizontal Bar
- #16:9
- #4-step diagram PowerPoint
- #linear process flow slide
- #aerobic exercise system diagram
- #step-by-step workflow PPT
- #icon diagram slide template
About the Product
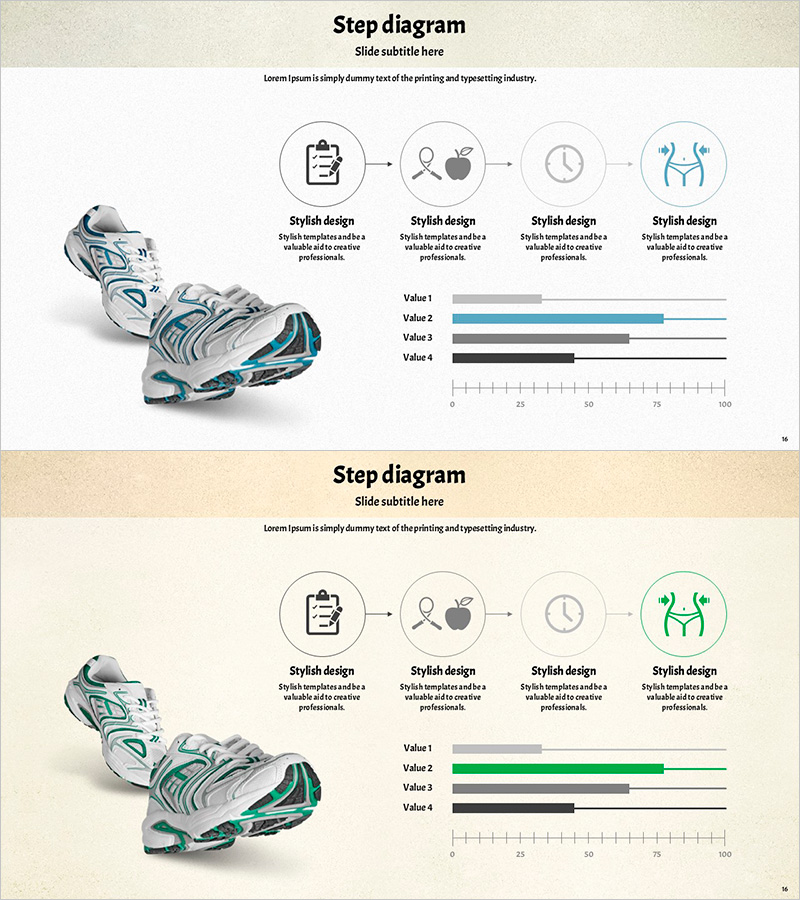
A PowerPoint slide featuring a 4-node linear diagram that visualizes the aerobic exercise process step-by-step. Each stage is represented by circular nodes with distinct icons (clipboard, person, clock, collaboration) connected by directional arrows in blue and green tones. A horizontal bar chart at the bottom displays comparative metrics across four data series, supporting quantitative analysis of each phase. The beige background with white layout enhances information clarity. Two-slide set includes color variations (blue and green versions) for flexible presentation styling.
Usage Points
-
Main Usage
Ideal for visualizing multi-phase aerobic exercise programs and strategic implementation plans. The four stages (planning, execution, monitoring, collaboration) are clearly represented through icons and arrows, while the bar chart simultaneously displays performance metrics for each phase.
-
How to Use
Suitable for corporate wellness program presentations, fitness center marketing pitches, and sports science educational materials. Customize node text and chart values to adapt the diagram for various processes such as sales pipelines, project management phases, or training curricula.
-
Recommended For
HR professionals, wellness coordinators, fitness instructors, sports scientists, and corporate trainers presenting process-based strategies. Recommended for any presentation requiring phase-by-phase performance comparison and visual workflow mapping.
-
Slide Structure
Slides 1–2: Four circular nodes with icons (clipboard, person, clock, collaboration) connected left-to-right by directional arrows. Horizontal bar chart below displays four data series on 0–100 scale. Color variants: blue tone (slide 1), green tone (slide 2). 16:9 aspect ratio, PPTX format.
Related Products
-

Business Strategy to Secure Market Competitiveness – Innovation and Success
#Product/Service Introduction #Business Vision and Strategy #Diagram
-

App-Based Personal Workout Booking System – Intuitive Diagram
#Product/Service Introduction #Diagram #Other
-

Visually Appealing Slide Template
#Product/Service Introduction #Diagram #Product/Service Introduction
-

Introduction to the Science Experiment Program – Linear Flow Diagram
#Product/Service Introduction #Marketing Plan and Strategy #Diagram
