Analyzing Data with Donut Chart – Green Orange Design
RJ0600066_4
- Last Update 07/07/2025
- File Size 8.5MB
- # of Slides 2
- File Format PPTX
- Slide Ratio 16:9
- Color
Keywords
About the Product
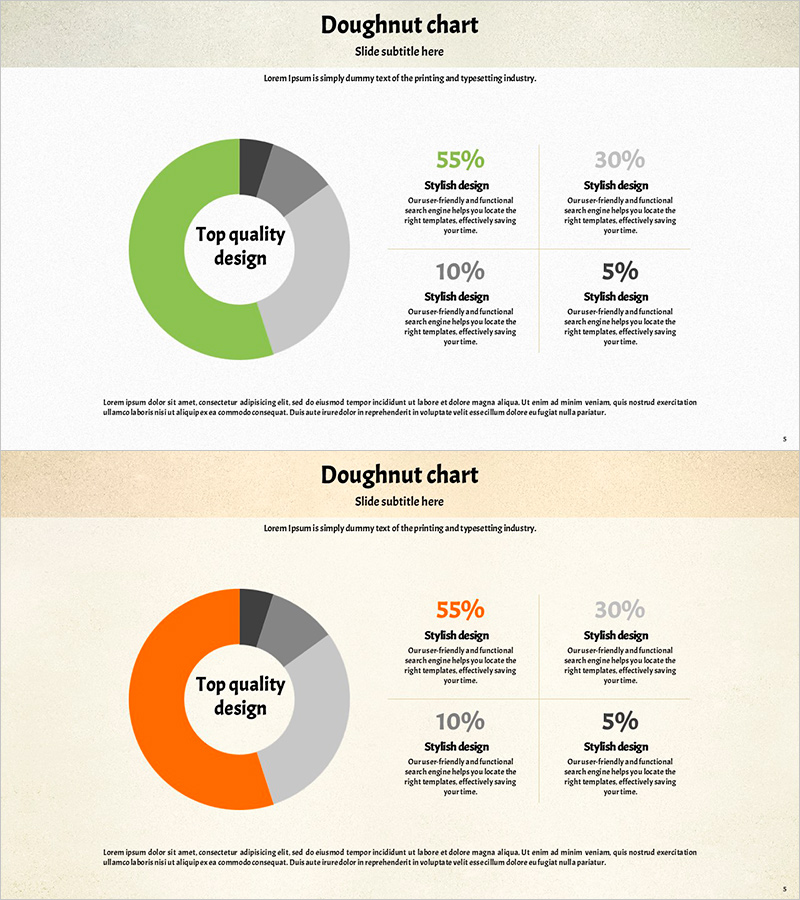
An intuitive donut chart PowerPoint slide for presenting ratio data with visual clarity. This presentation template features two layout variations in green and orange dual-tone colors, with each slide displaying the composition of four data segments. The circular center space accommodates key messages or titles, creating harmonious integration between chart and text. Ideal for marketing performance reports, customer satisfaction surveys, budget allocation, market share analysis, and other statistical presentations that require effective data visualization.
Usage Points
-
Main Usage
Optimized for visualizing composition ratios, market share, and part-to-whole relationships with clarity. The circular center space allows placement of key messages or titles that integrate naturally with the chart. Commonly used for marketing performance analysis, customer satisfaction surveys, budget distribution, market share reporting, and statistical presentations.
-
How to Use
Double-click the donut chart segments to input data, which automatically calculates and displays proportions. Add descriptions and numerical values in the right-side text area to enhance audience comprehension. The green and orange color scheme can be customized to match corporate branding. Choose between two layout variations based on your presentation context.
-
Recommended For
Recommended for marketing teams presenting campaign performance, sales teams analyzing results, finance teams explaining budget status, executive reports, academic presentations, and consulting proposals. Particularly effective when communicating statistical data organized into four or fewer categories.
-
Slide Structure
Two-slide set with each slide featuring a 4-segment donut chart on the left (green, orange, gray, and white center circle) and corresponding percentage values with descriptive text on the right. Designed in 16:9 widescreen format for modern presentation environments.
Related Products
-

Social Contribution Spending Chart – Key to Financial Planning
#Financial Plans and Performance #Graph #Budget
-

Trends Visualized with Line Chart
#Technical Approach #Market and Competitor Analysis #Graph
-

Market Analysis Graph Ahead of the Future – Innovative Business Insights
#Market and Competitor Analysis #Diagram #Graph
-

User Analysis Status by Year – Growth and Change
#Product/Service Introduction #Market and Competitor Analysis #Graph
