Connecting Diagram for Weight-Loss Program Course Enhancement
RJ0600066_13
- Last Update 07/07/2025
- File Size 8.5MB
- # of Slides 2
- File Format PPTX
- Slide Ratio 16:9
- Color
Keywords
- #Content-Based Slides
- #Design-Based Slides
- #Business Strategy
- #Business Management
- #Diagram
- #Implementation Framework
- #Execution Plan
- #Flow
- #Cluster
- #Linear Flow
- #Chain Diagram
- #16:9
- #connection diagram PowerPoint
- #process flow slide template
- #6-step linear diagram
- #business strategy presentation
- #sequential flowchart PPT
About the Product
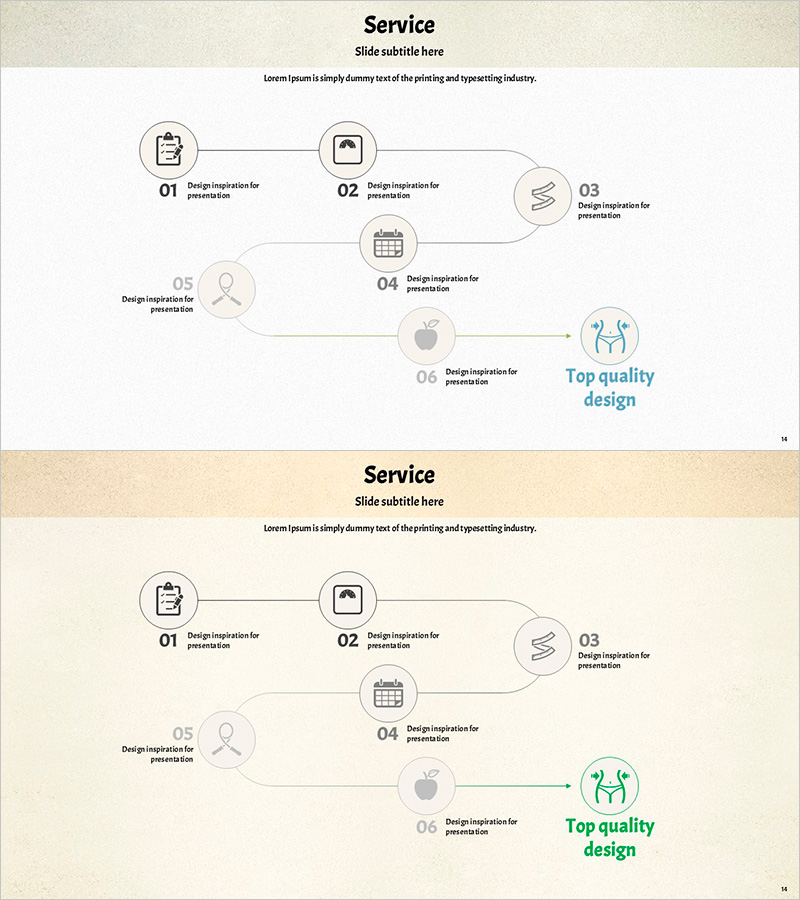
A process flow diagram PowerPoint slide featuring six nodes connected in linear sequence. This presentation template uses icon-based stages to visualize business strategies, program progression, and service workflows. The design combines a beige background with gray connecting lines and blue accent elements, providing text description areas for each stage. The 2-slide set is optimized for 16:9 widescreen format and enables flexible representation of various sequential processes.
Usage Points
-
Main Usage
Ideal for expressing linear processes such as business strategies, program phases, service workflows, project stages, and customer journeys in clear sequential steps. Each node combines icons and text to enhance information delivery and audience comprehension.
-
How to Use
Customize the icon and text in each stage node to match your specific process. Adjust background colors, connecting line colors, and icon colors to align with your brand identity. Use both slides to compare and contrast different process flows or present multiple sequential scenarios.
-
Recommended For
Suitable for business plans, marketing proposals, pitch decks, project reports, training materials, and program presentations. Effective for explaining strategic implementation, process improvement initiatives, new service launches, and organizational change management with step-by-step execution plans.
-
Slide Structure
Six nodes arranged in linear sequence from left to right. Each node consists of a circular icon area and text description field below, connected by directional arrows. The final node is highlighted as an end-goal emphasis area, creating visual closure for the process flow.
Related Products
-

Diagram Slide Connecting Business Strategy
#Business Strategy #Diagram #Implementation Framework
-

Science Experiment Plan Diagram – Step-by-Step Implementation System
#Business Strategy #Diagram #Step-by-Step Schedule Plan
-

Sleek Presentation Template Emphasizing Business Context
#Business Strategy #Operational Plan #Technical Approach
-

Colors Theme Presentation Template Sequence Diagram – Ideal for Business Execution Strategy
#Business Strategy #Business Management #Diagram
