Green Orange Highlight Connection Diagram
RJ0600066_7
- Last Update 07/07/2025
- File Size 8.5MB
- # of Slides 2
- File Format PPTX
- Slide Ratio 16:9
- Color
Keywords
- #Content-Based Slides
- #Design-Based Slides
- #Business Strategy
- #Diagram
- #Production Plan
- #Implementation Framework
- #Cluster
- #Spread
- #Chain Diagram
- #Centralized Diagram
- #16:9
- #central connection diagram PowerPoint
- #relationship diagram slide template
- #5-node diagram
- #radial diagram PPT
- #business strategy slide
- #how to create connection diagram in PowerPoint
About the Product
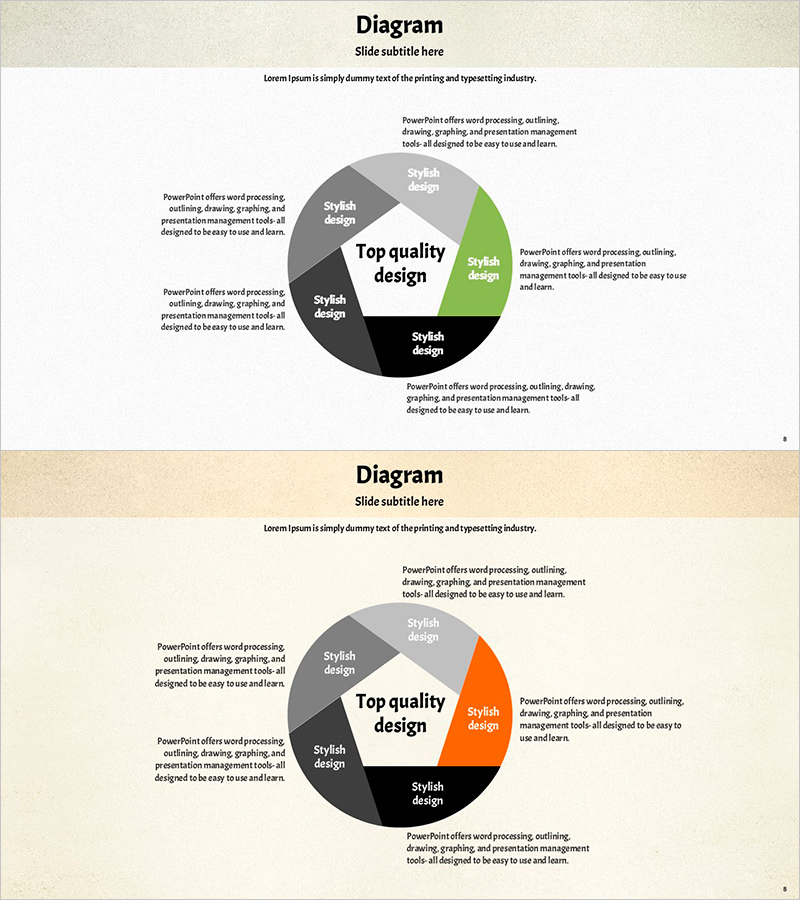
A central connection diagram PowerPoint slide that visualizes relationships and influence among five key elements radiating from a core concept. This presentation template is ideal for illustrating business strategy execution, production planning, organizational relationships, and process connectivity. The green and orange accent colors on nodes and connecting lines clearly distinguish information hierarchy, with ample text input areas for immediate editing. The 2-slide set adapts to various presentation scenarios and professional contexts.
Usage Points
-
Main Usage
Designed to clearly display relationships, influence, and connectivity between a core concept and surrounding elements at a glance. Effectively expresses business strategy execution (central goal to implementation tasks), production planning (inter-process relationships), and cluster analysis (item interactions) in a single visual framework.
-
How to Use
Enter the core concept (goal, strategy, core value) in the central circular node, then populate the five surrounding nodes with detailed items. Use connecting line direction and color to differentiate impact levels and priorities, and add text descriptions to clarify each element's role. Ideal for executive presentations, strategy meetings, and team briefings to enhance audience comprehension.
-
Recommended For
Suited for executives, strategy planners, project managers, production managers, and organizational development specialists preparing strategy documents, process designs, and organizational charts. Applicable to business plans, management reports, organizational restructuring proposals, marketing strategies, and production plans requiring relationship visualization and radial structure.
-
Slide Structure
Two-slide set with each slide featuring one central circular node and five surrounding connected nodes. Nodes are color-coded in green, orange, gray, and black to distinguish relationships. Connecting lines extend from center to periphery, with text input areas in each node for flexible editing of item names and descriptions. Beige-toned background maintains professional appearance throughout.
Related Products
-

Mobile Video Viewing App System – Business Strategy Diagram
#Business Strategy #Diagram #Production Plan
-

Visualizing Business Strategy with Tree Silhouette Diagram
#Product/Service Introduction #Business Strategy #Diagram
-

Diagram Slide Visualizing Technology Utilization System
#Business Introduction #Business Strategy #Diagram
-

Types of Agricultural Equipment Machinery – Well-Organized Diagram
#Business Strategy #Diagram #Production Plan
