Smart City Presentation Template – Modern and Visually Appealing Design
J0300093
- Last Update 08/29/2025
- File Size 29.1MB
- # of Slides 30
- File Format PPTX
- Slide Ratio 16:9
- Color
Slide Preview
Keywords
About the Product
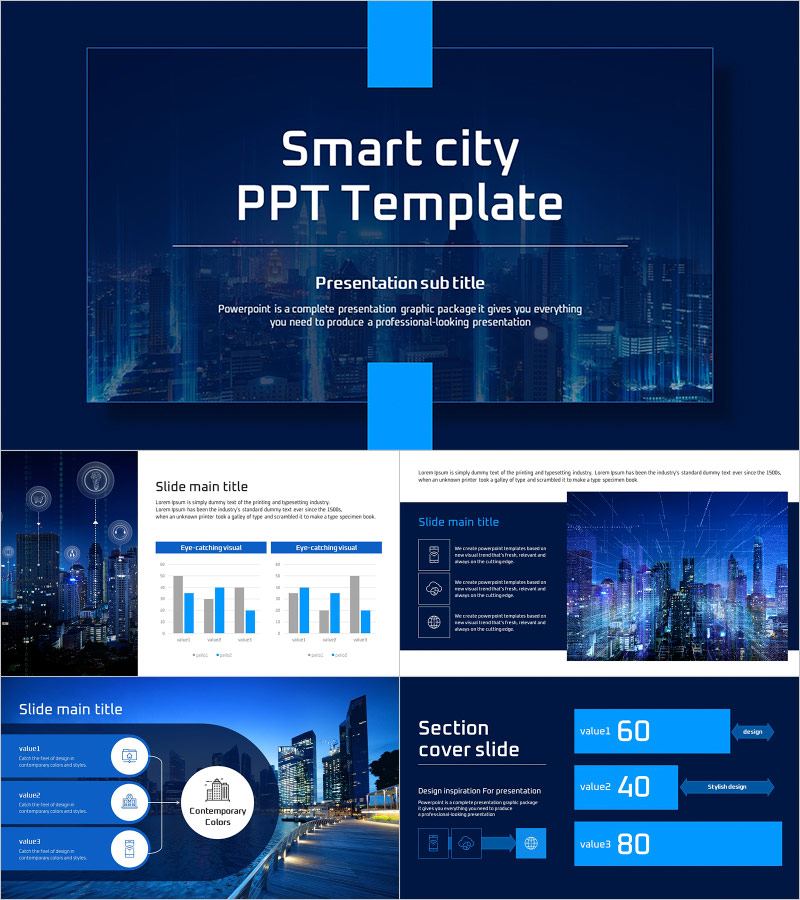
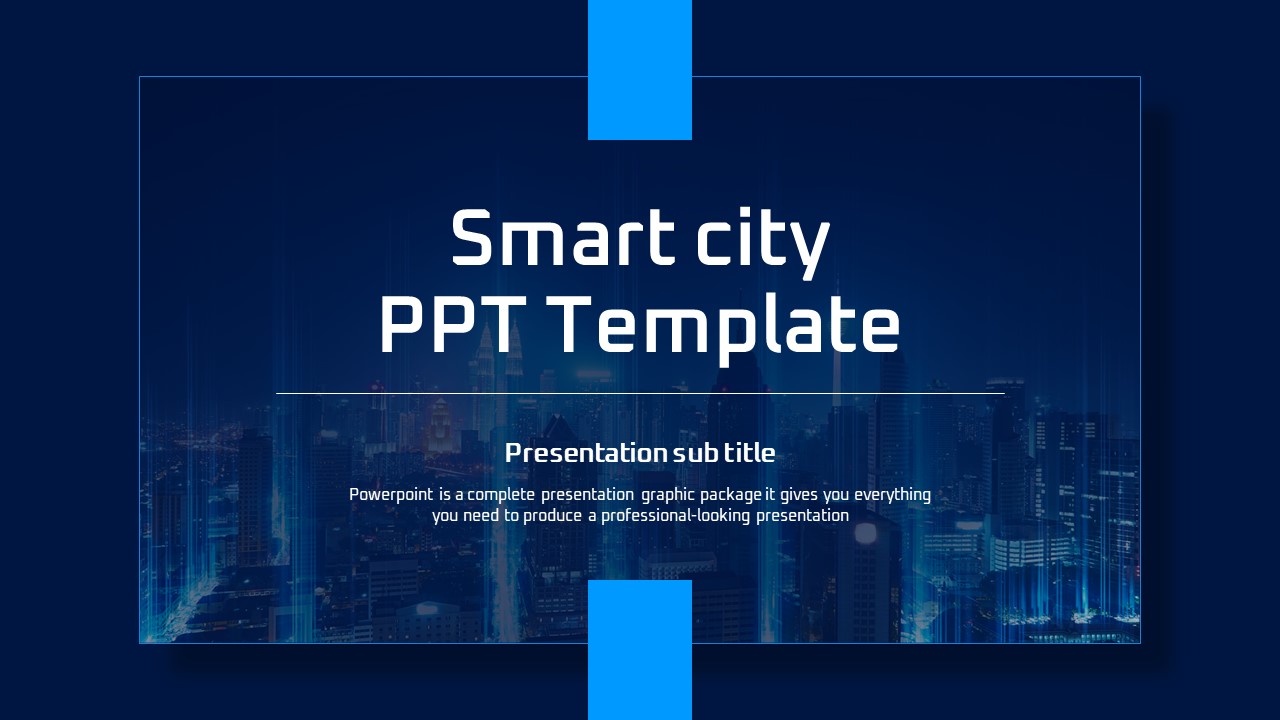
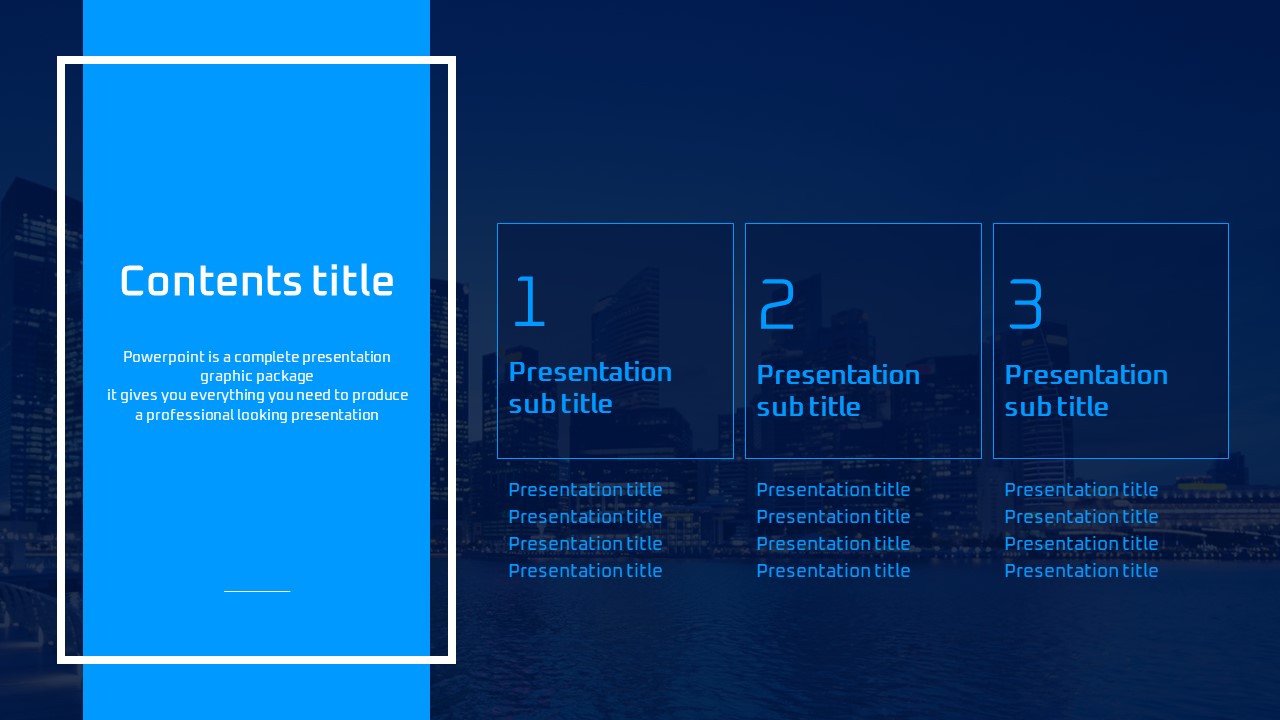
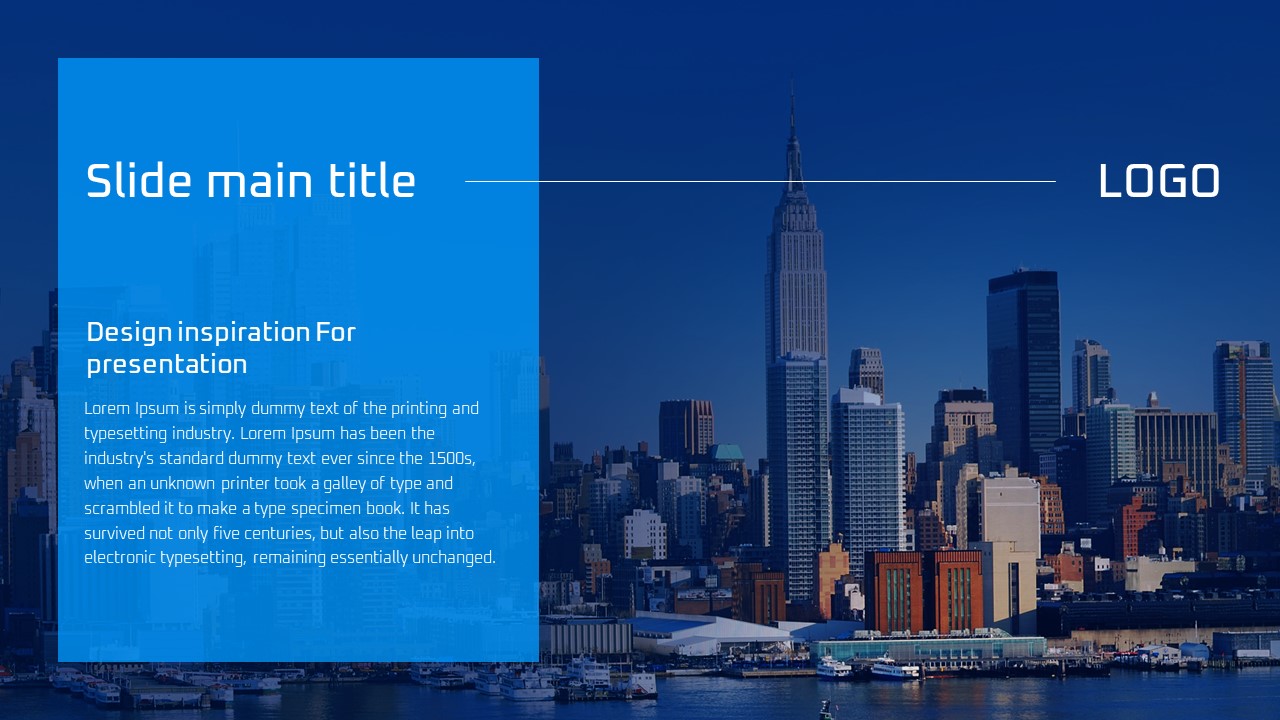
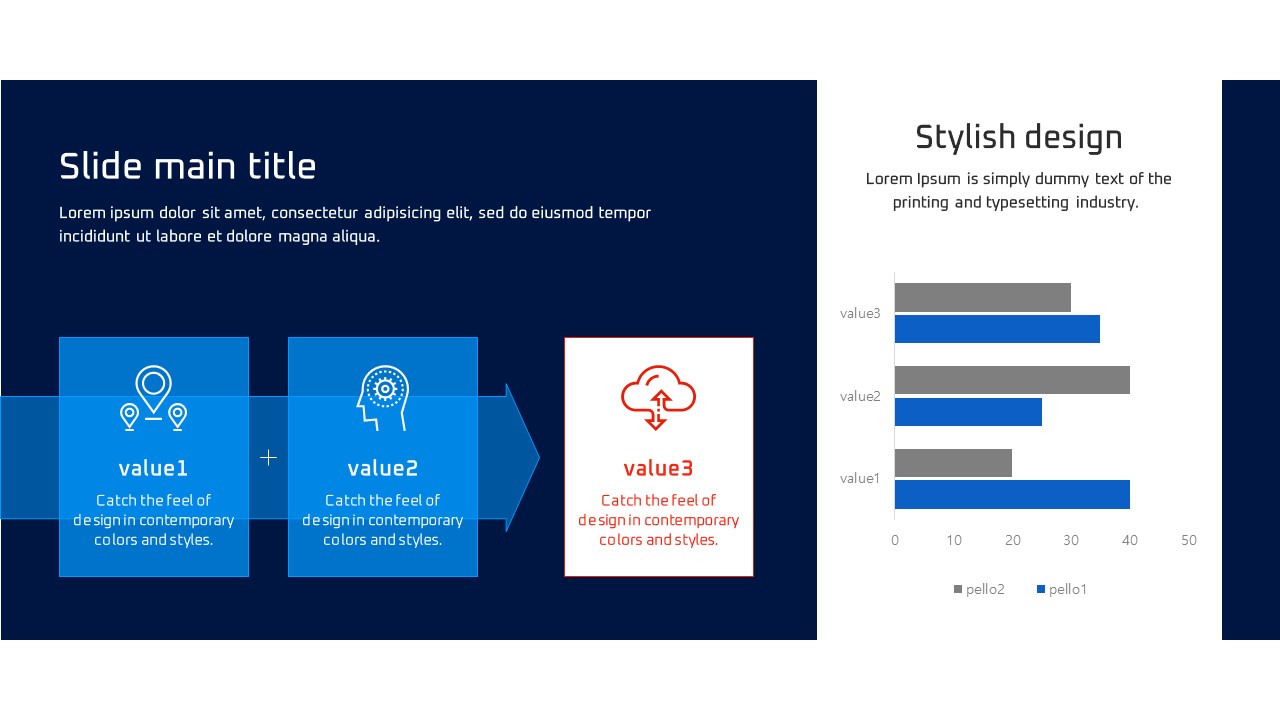
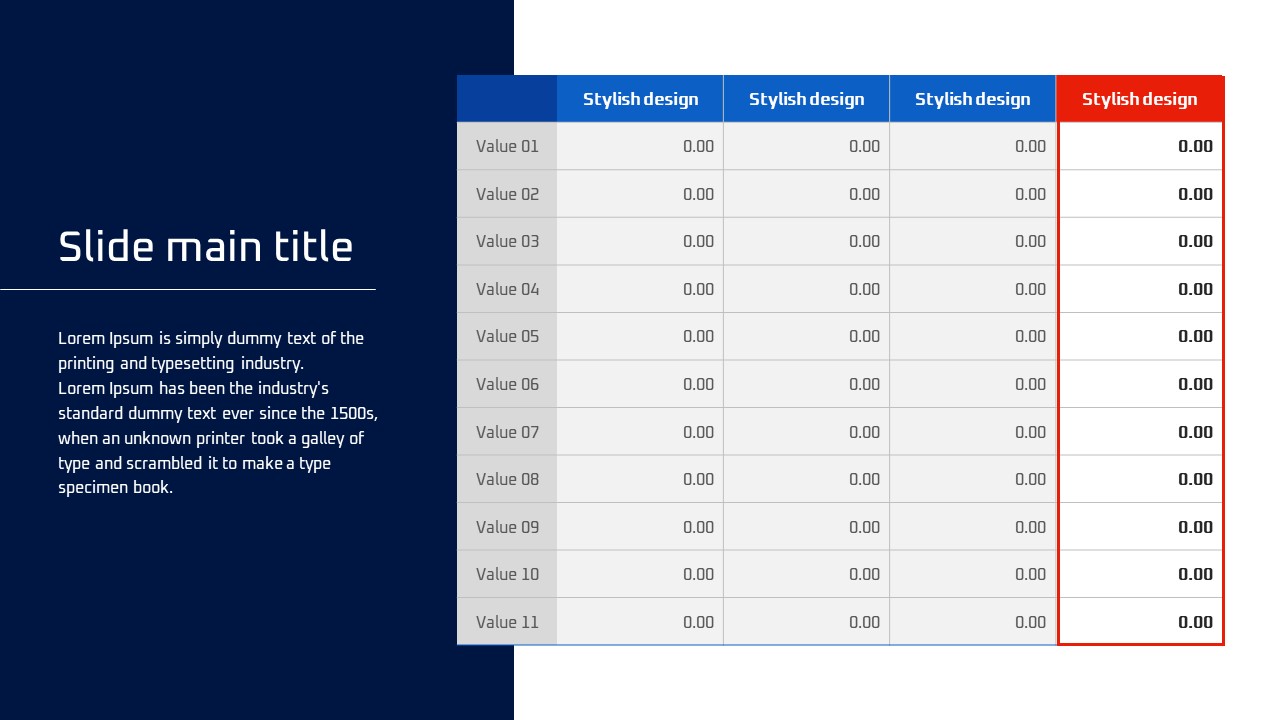
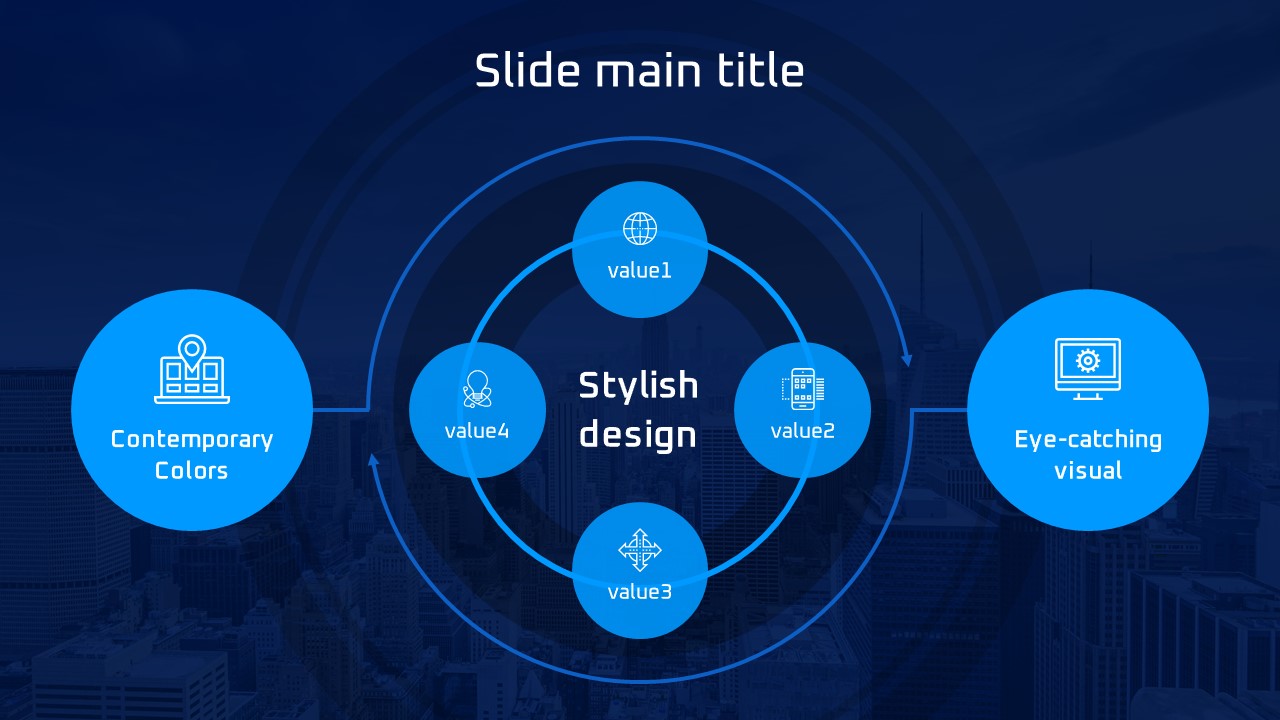
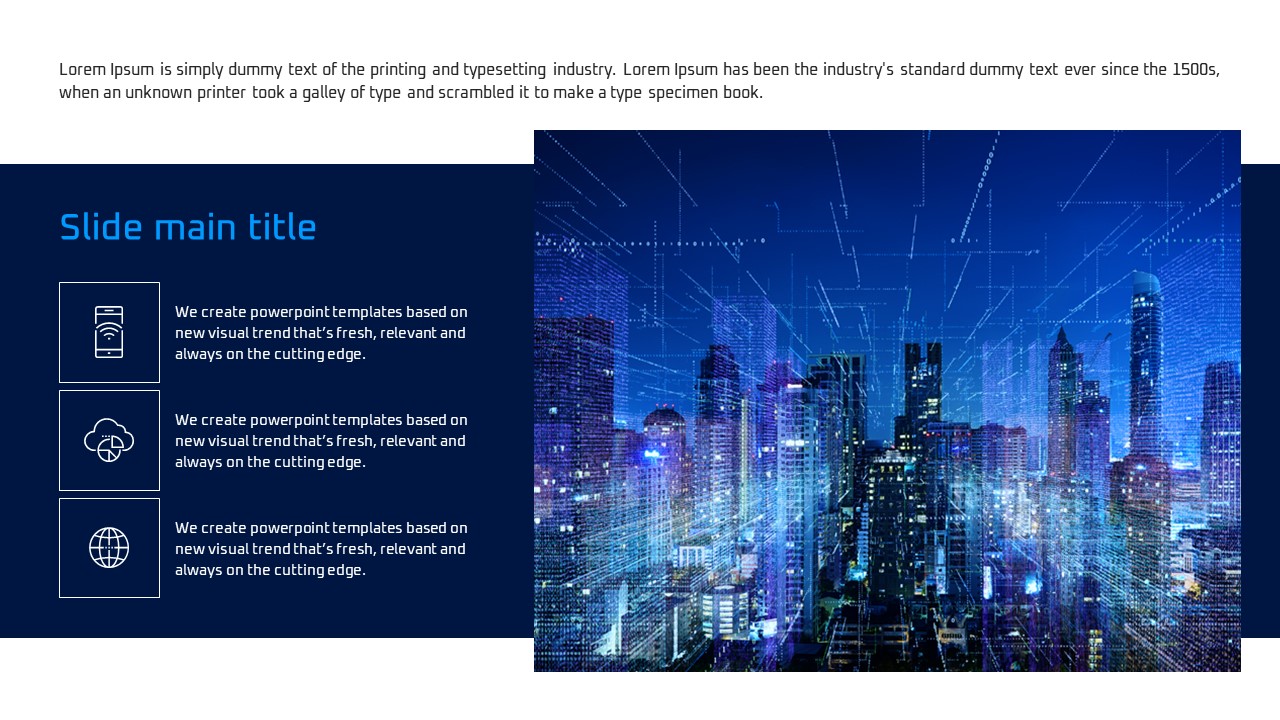
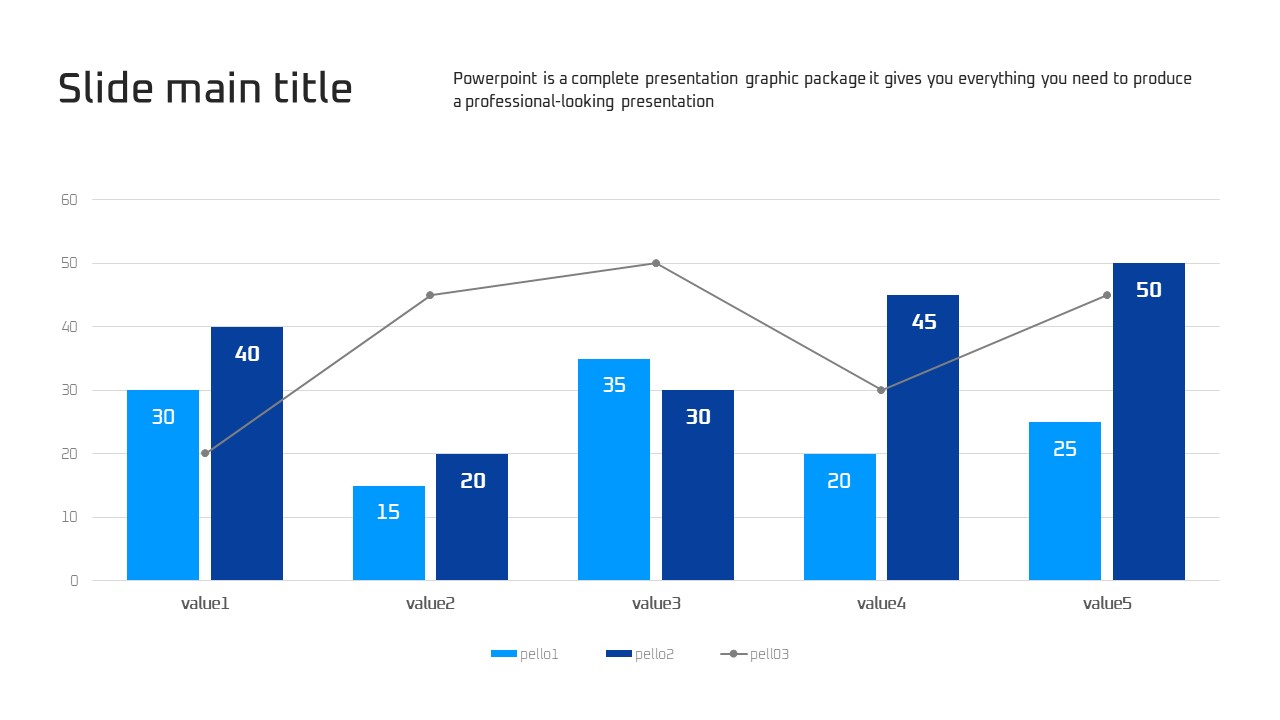
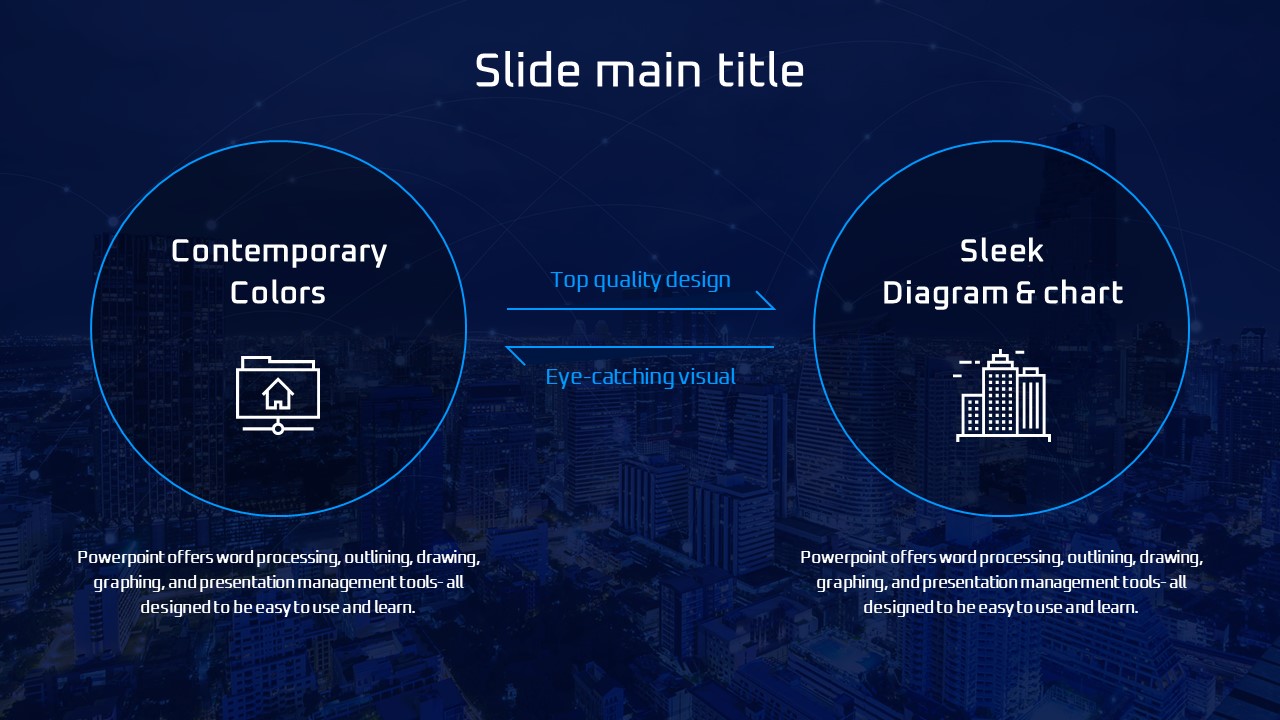
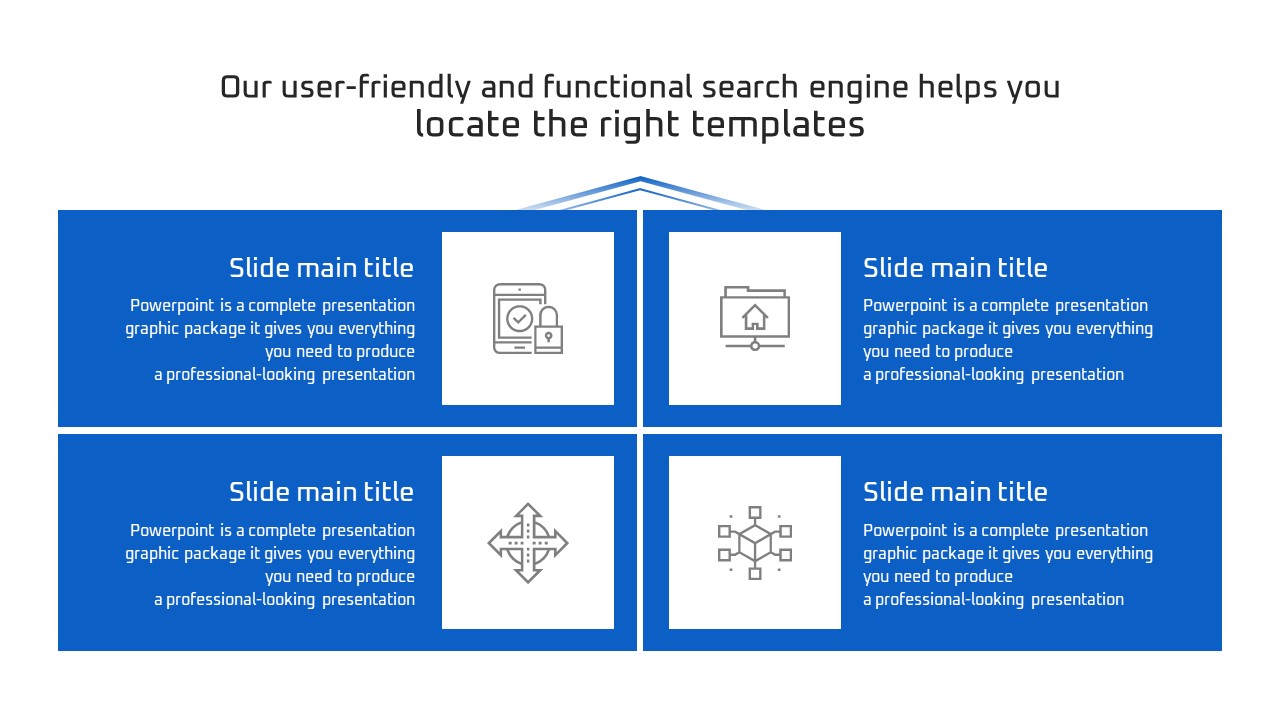
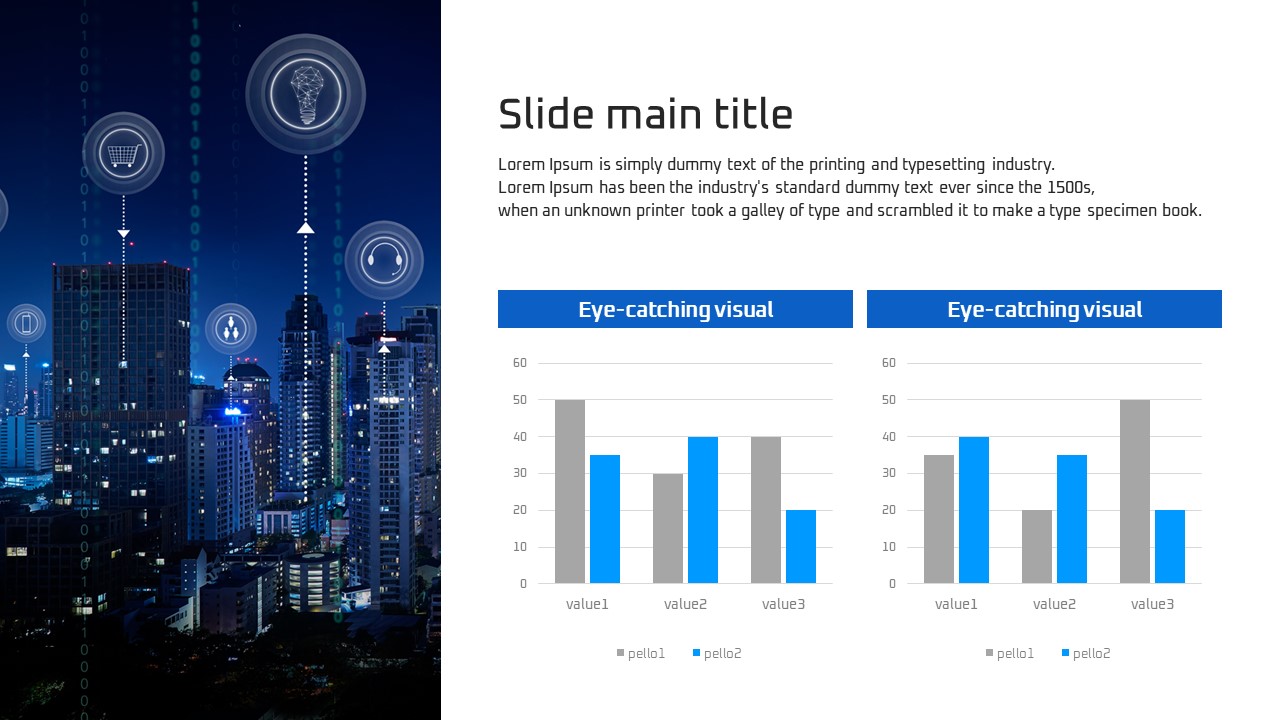
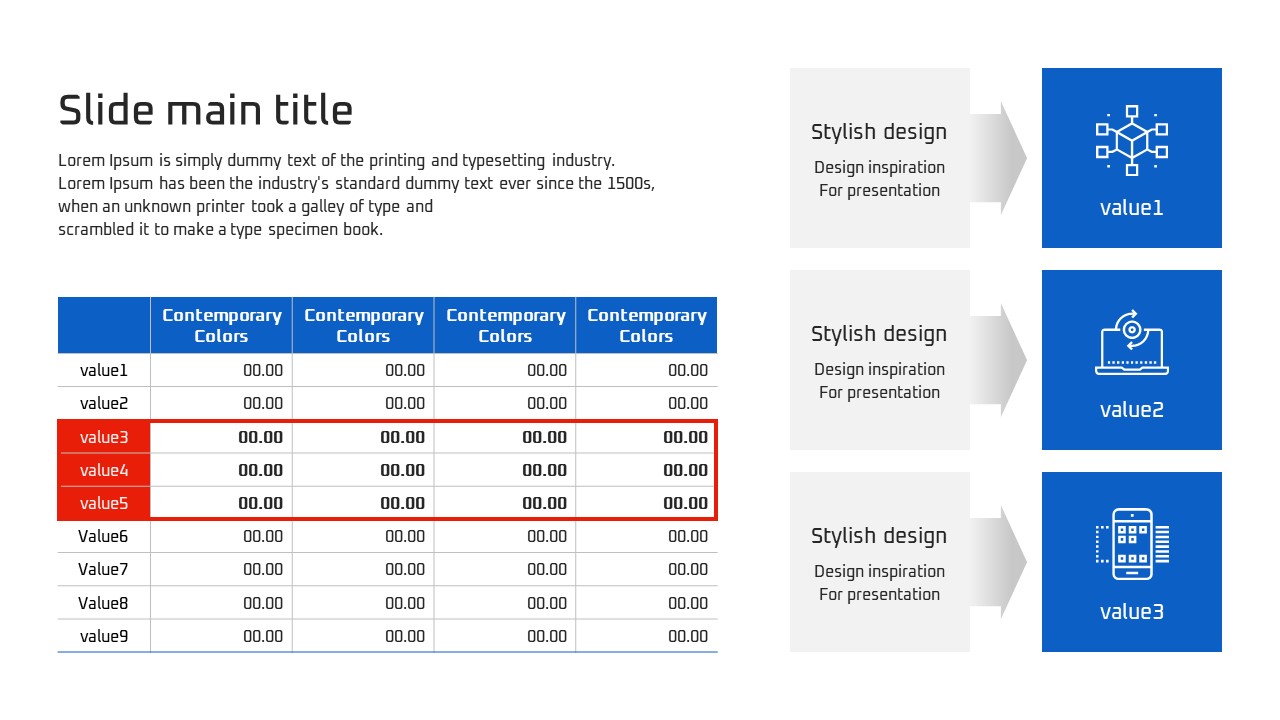
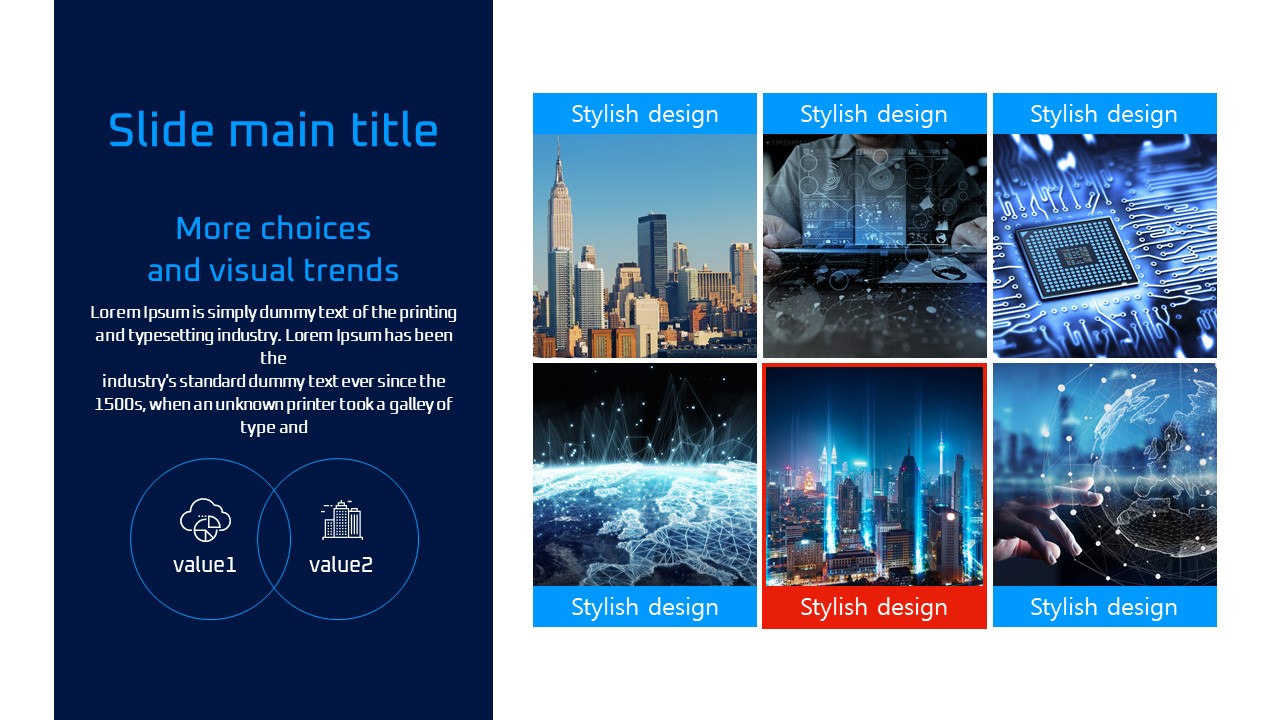
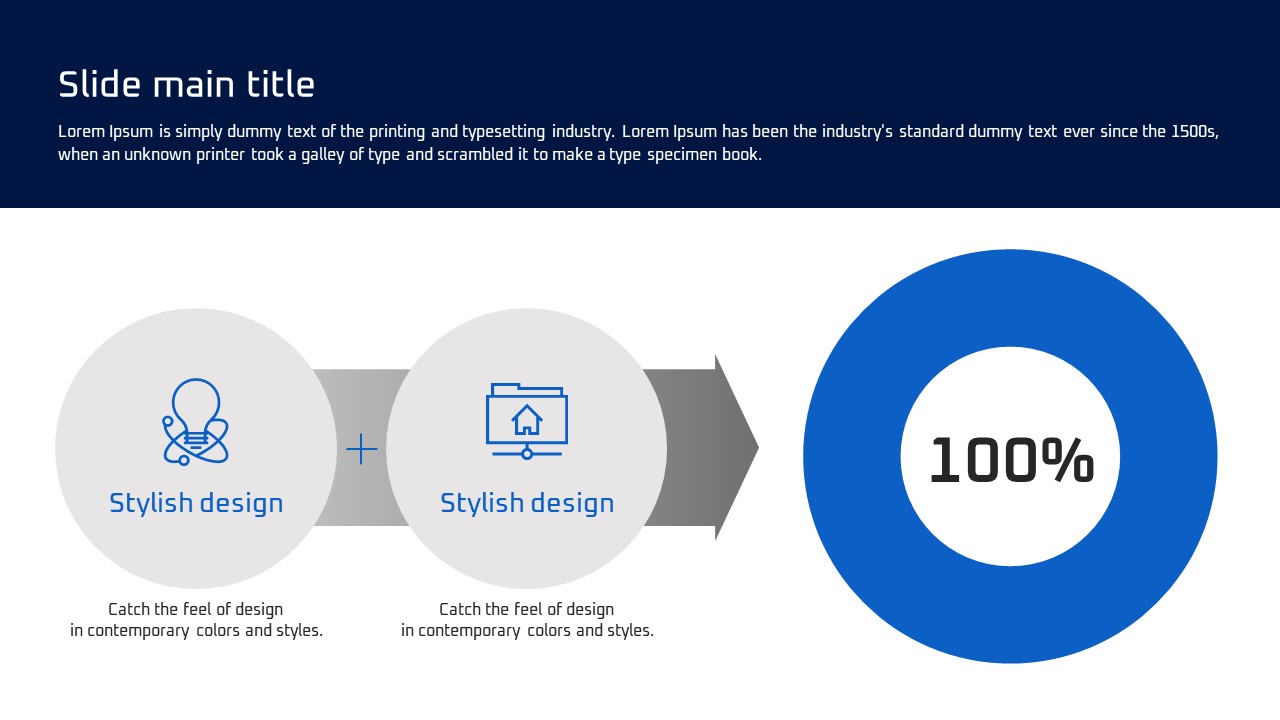
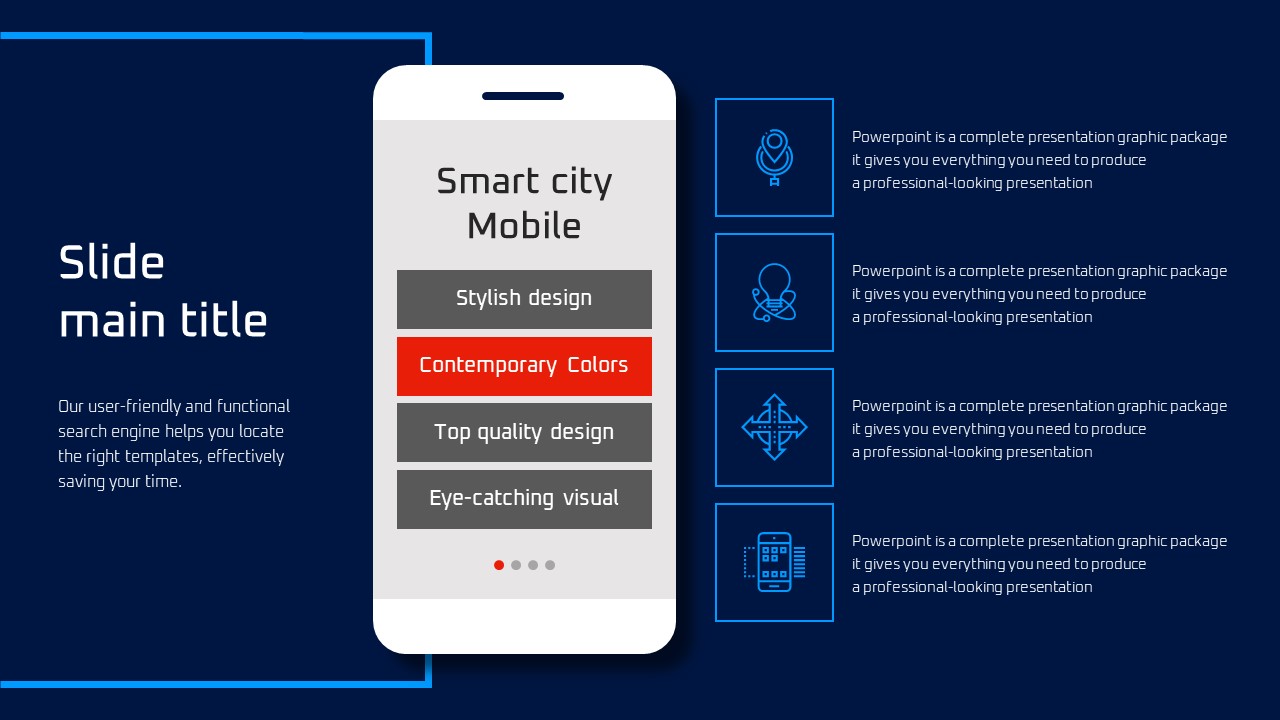
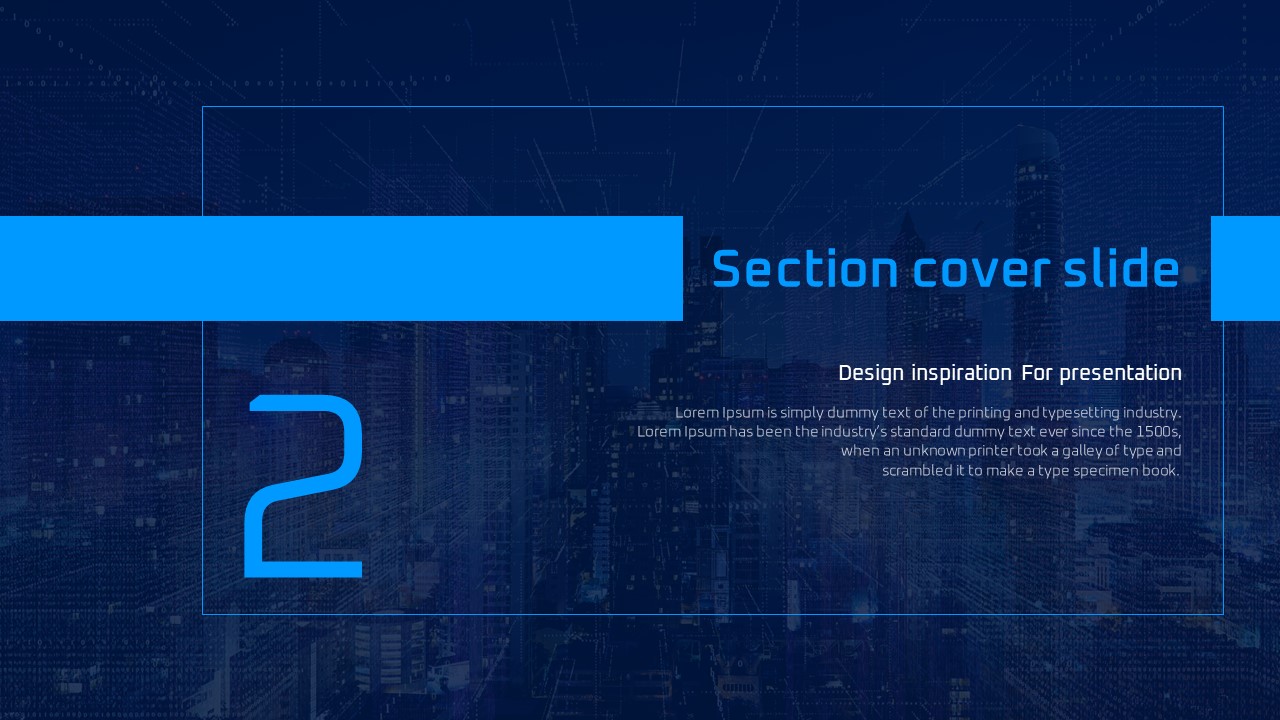
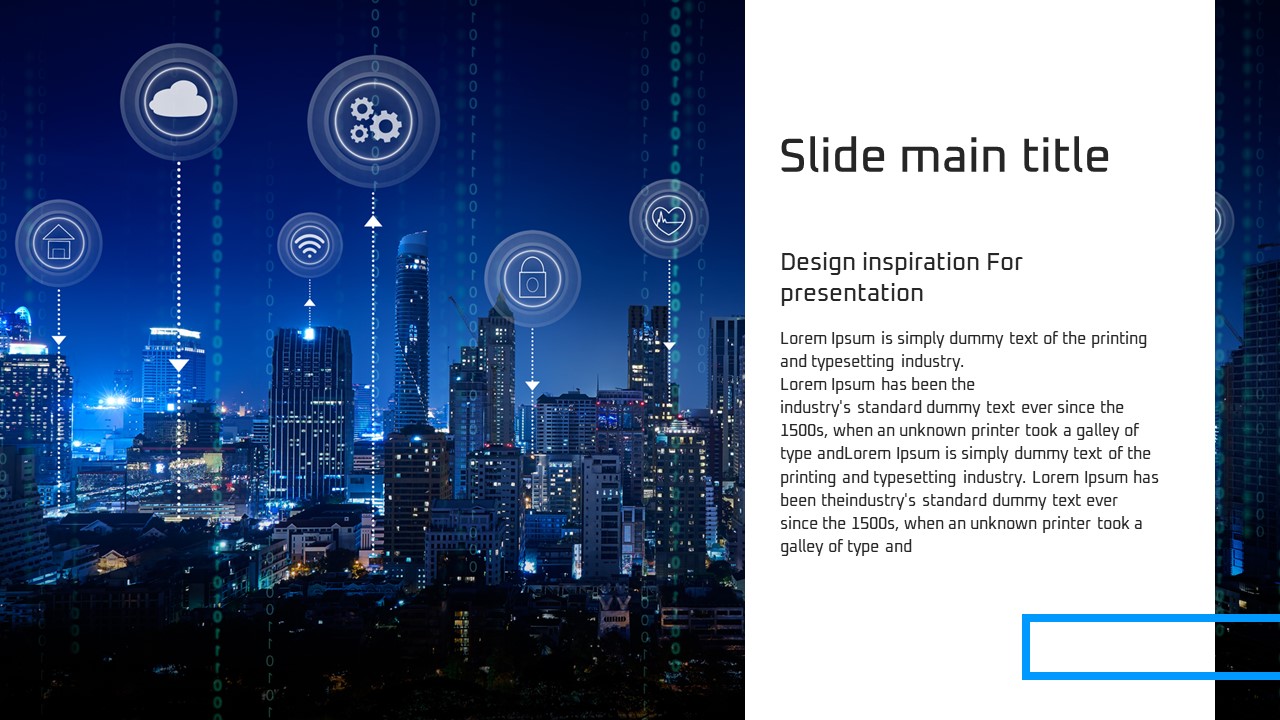
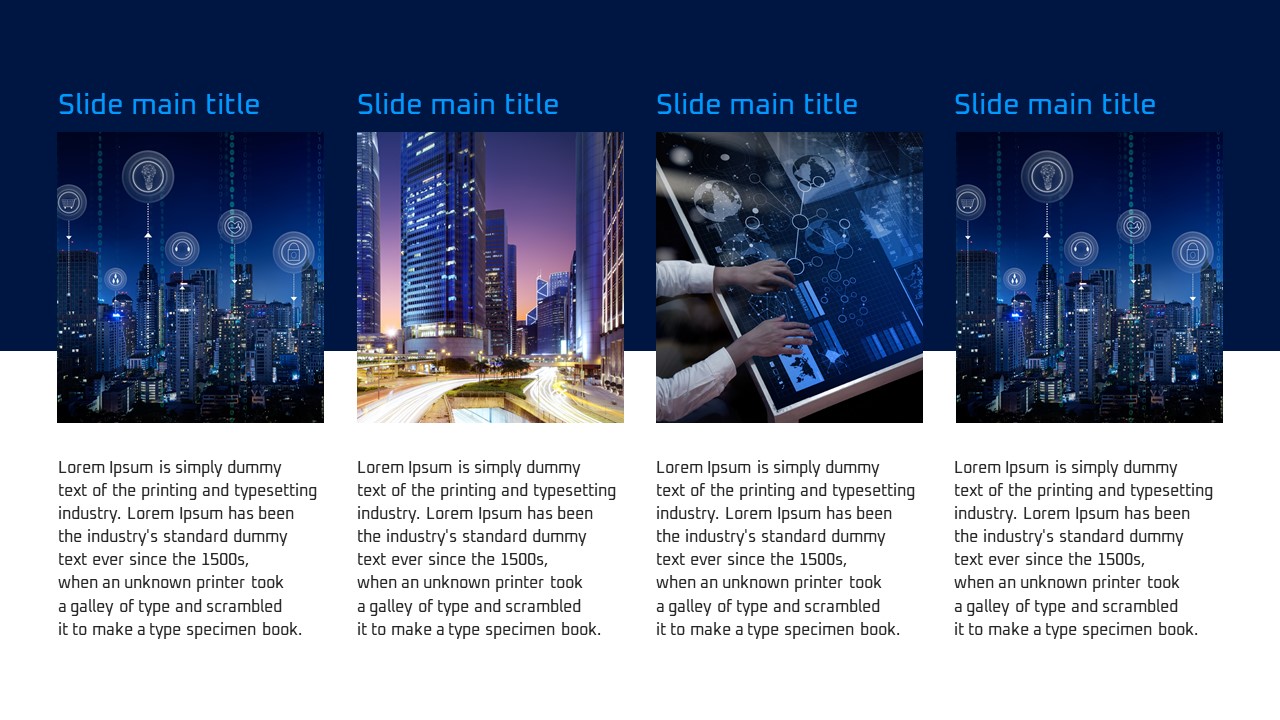
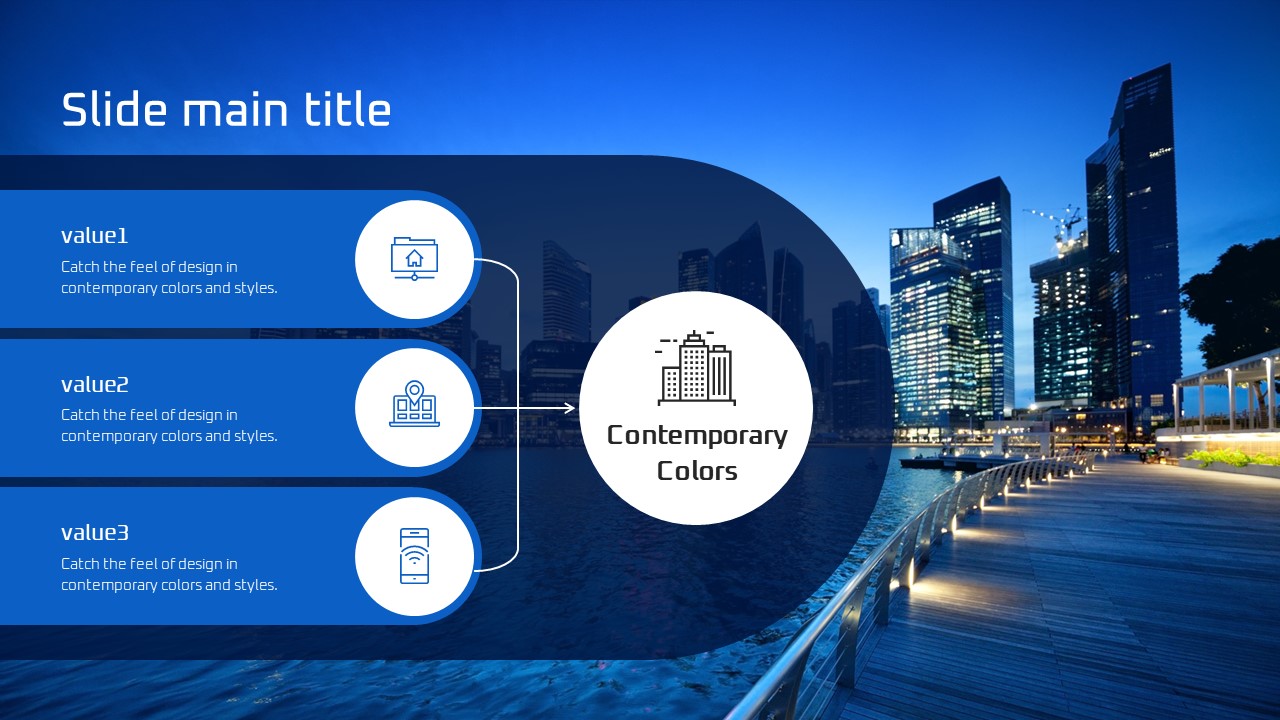
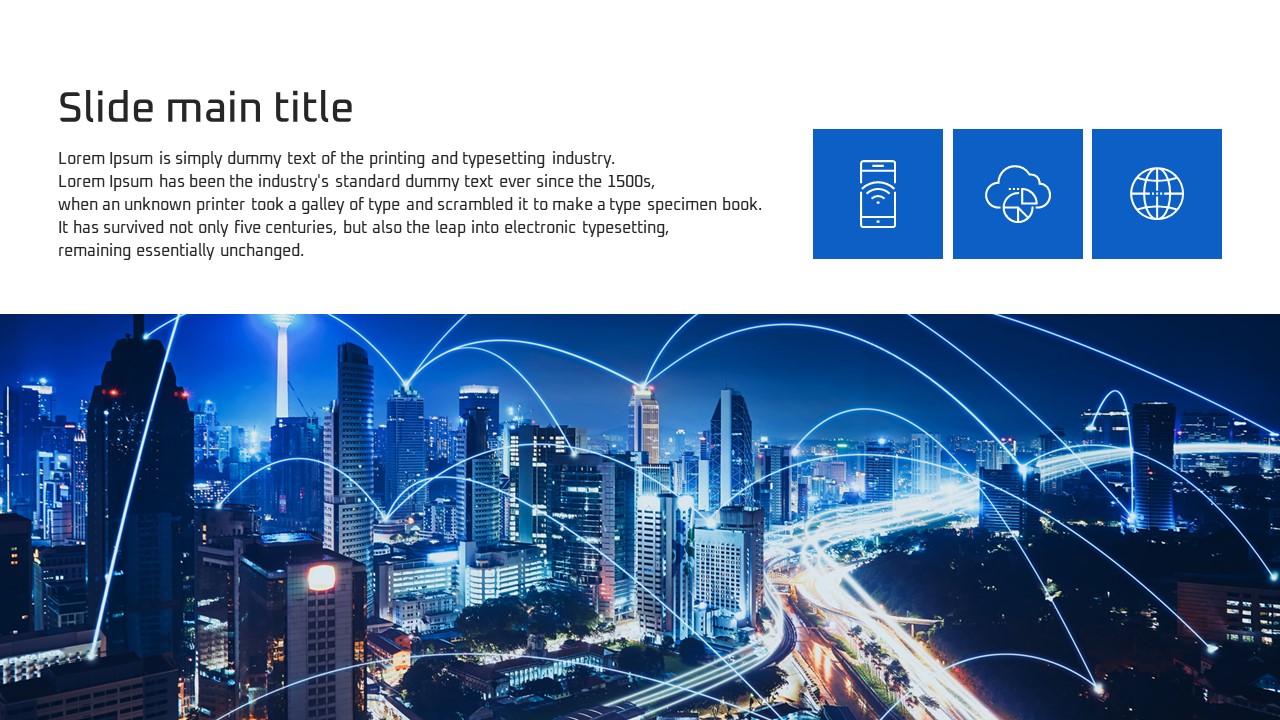
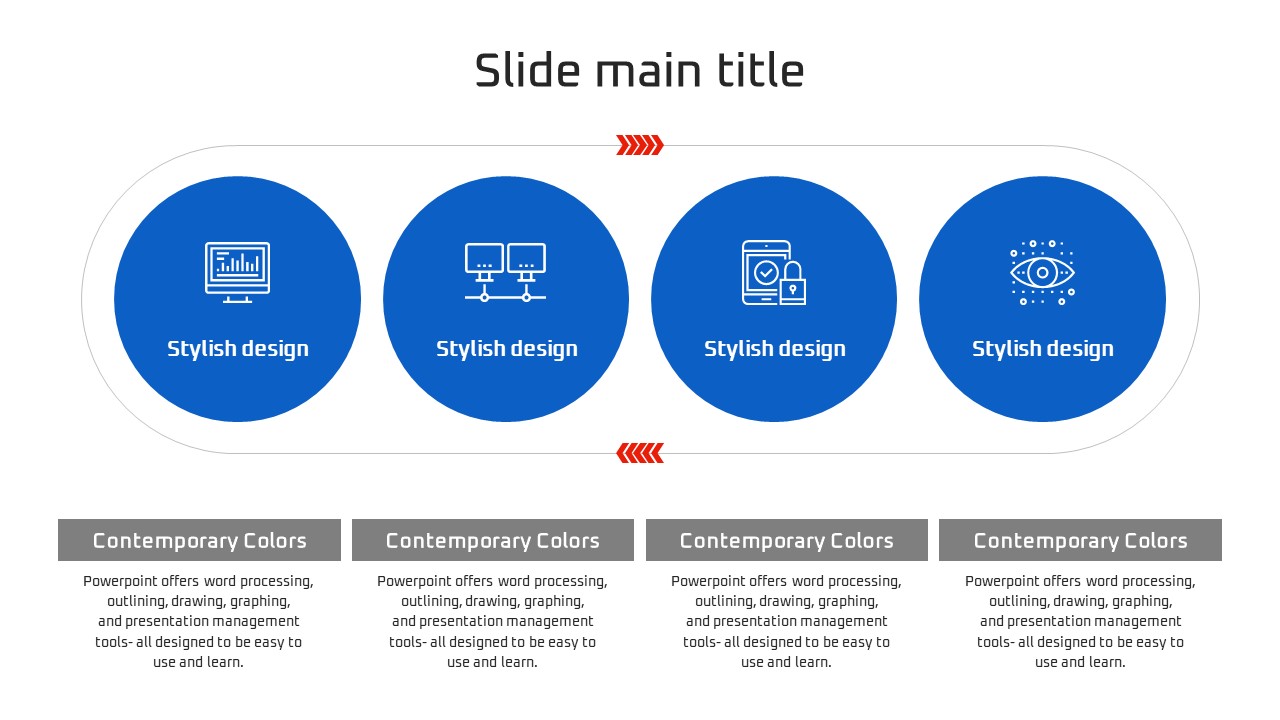
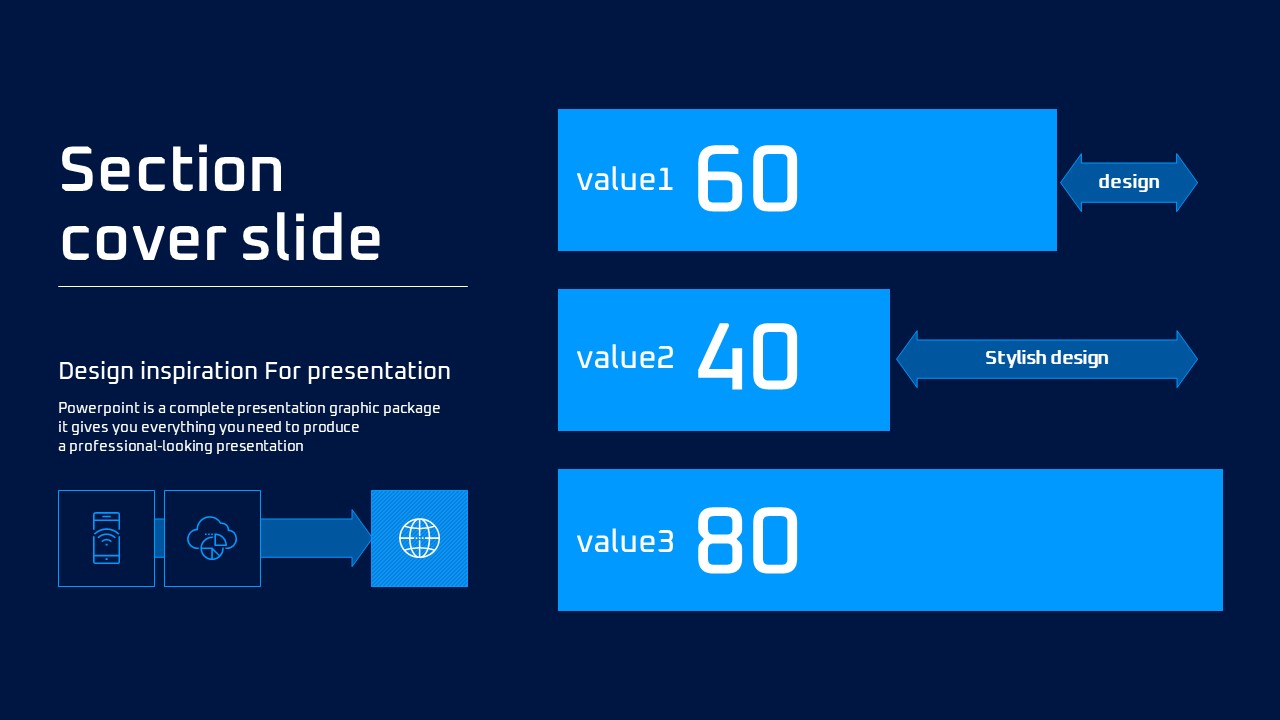
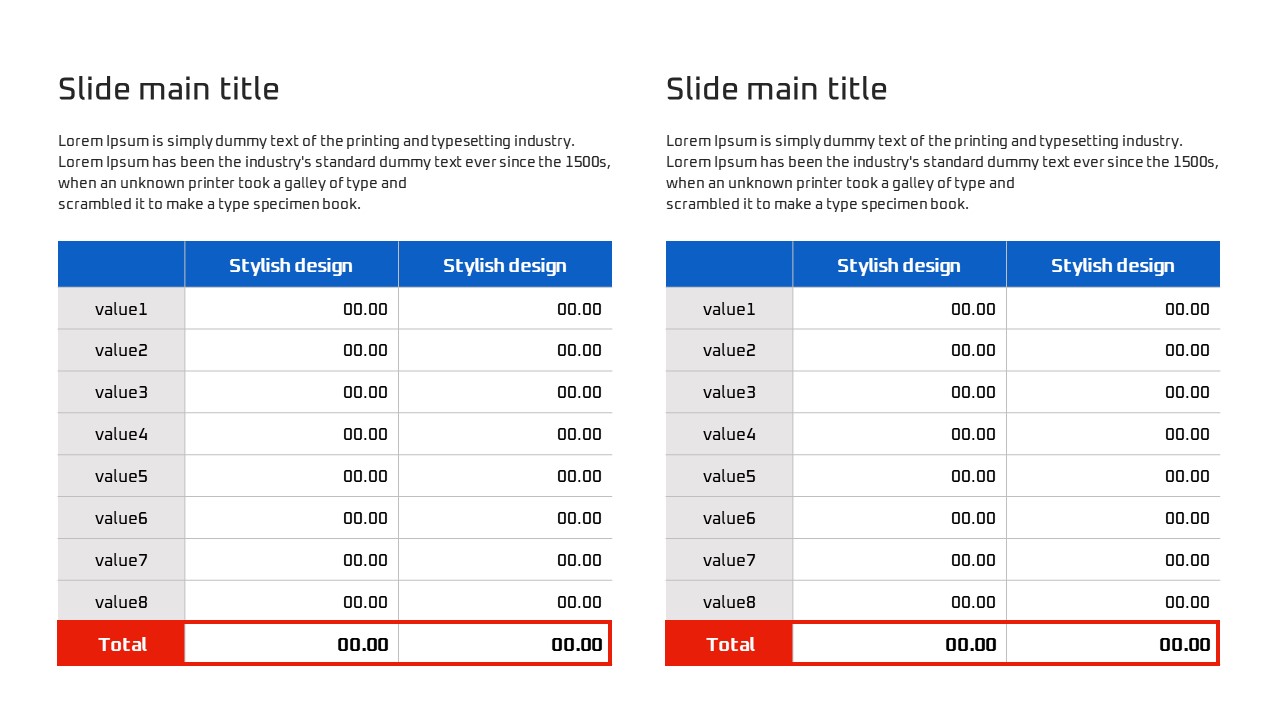
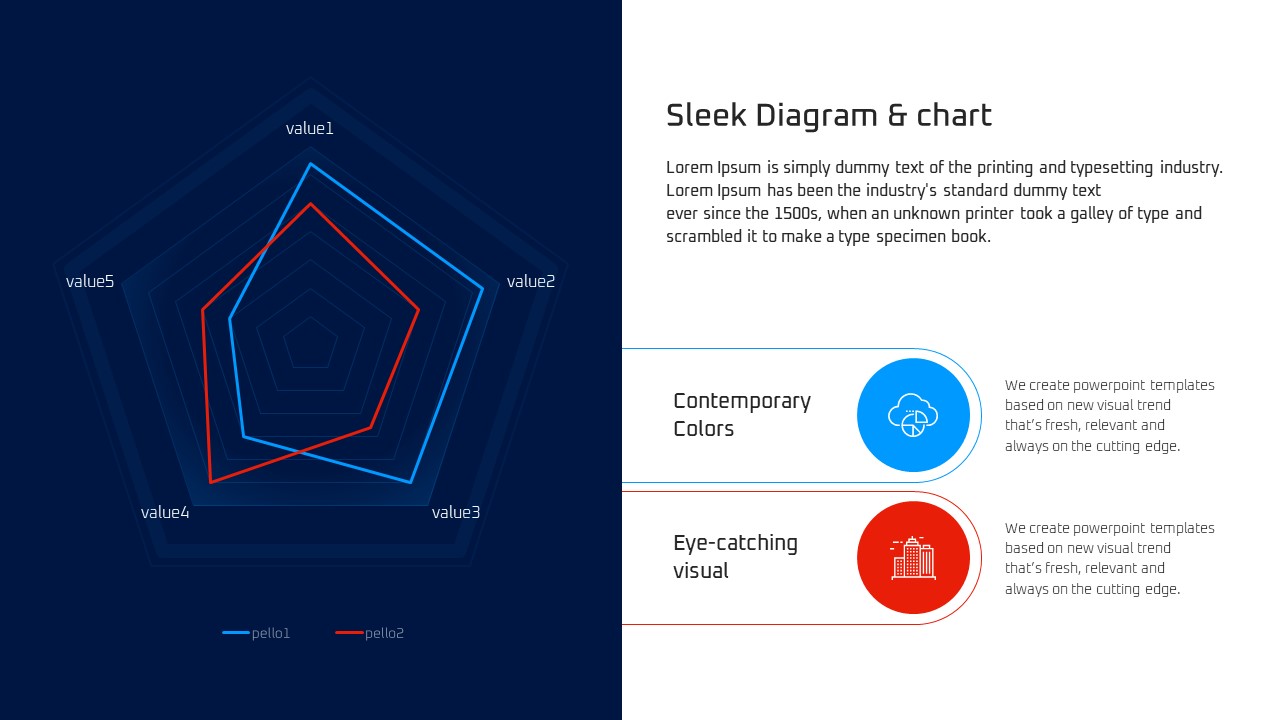
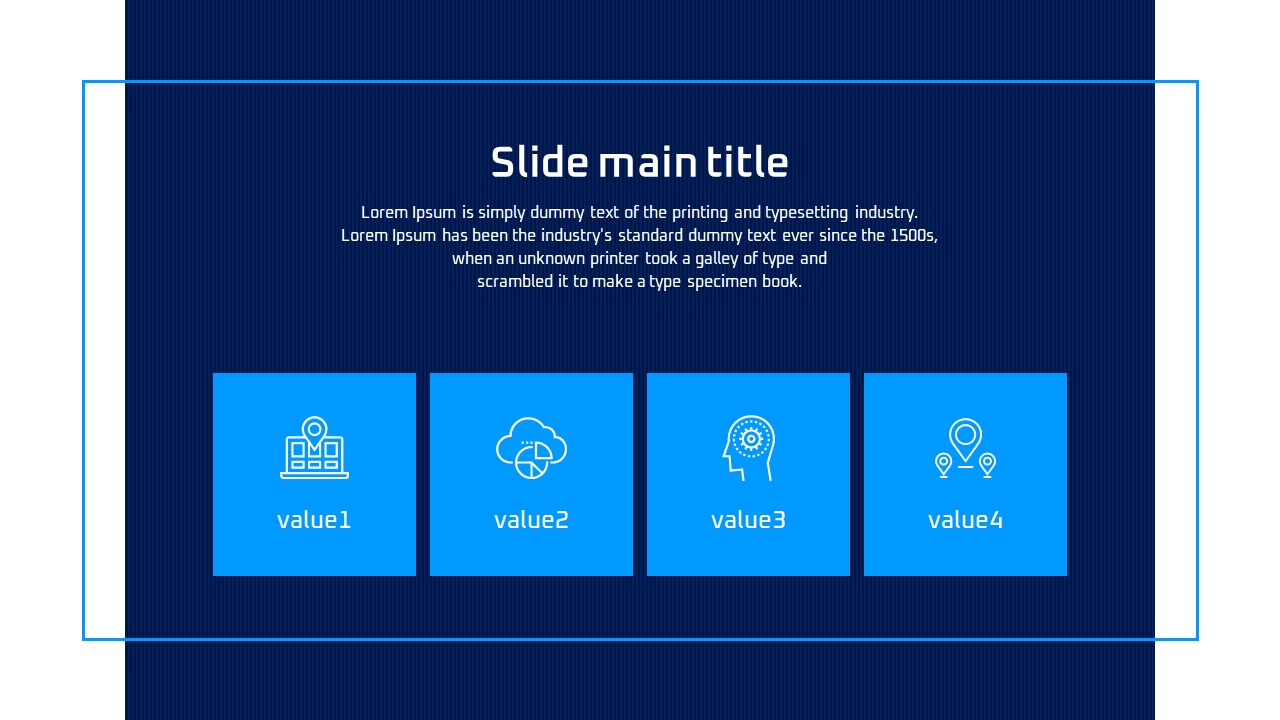
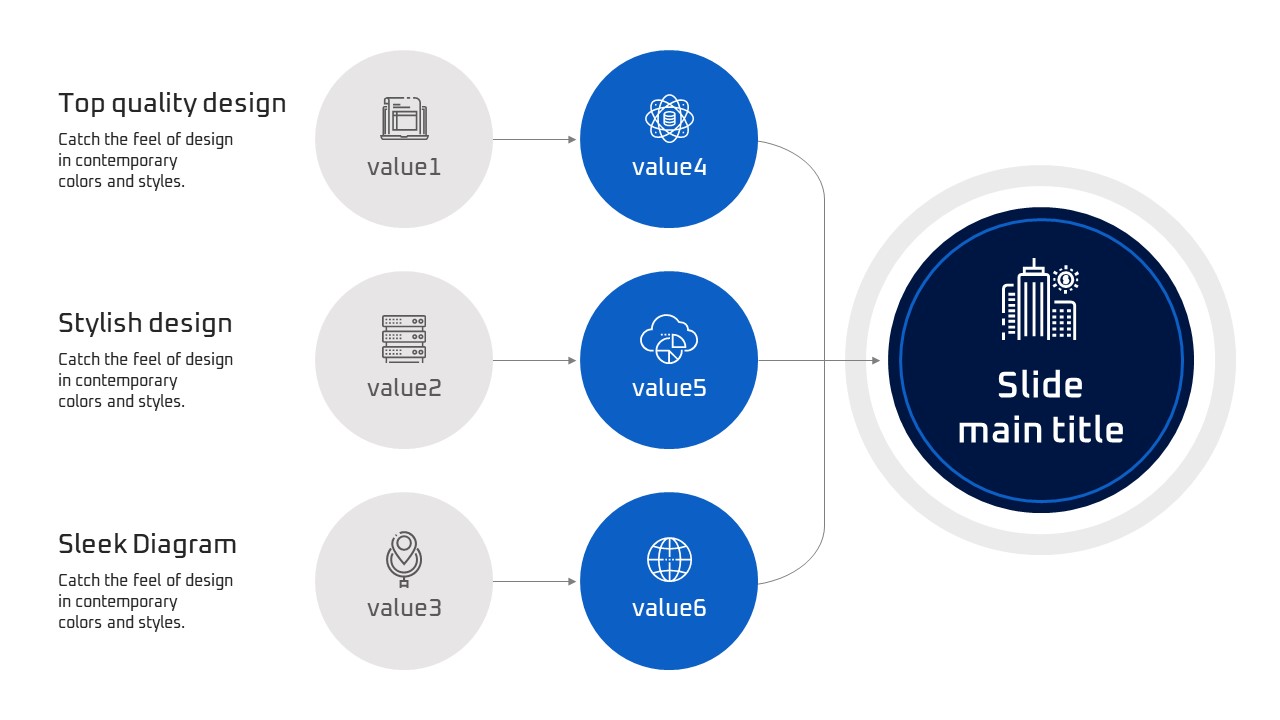
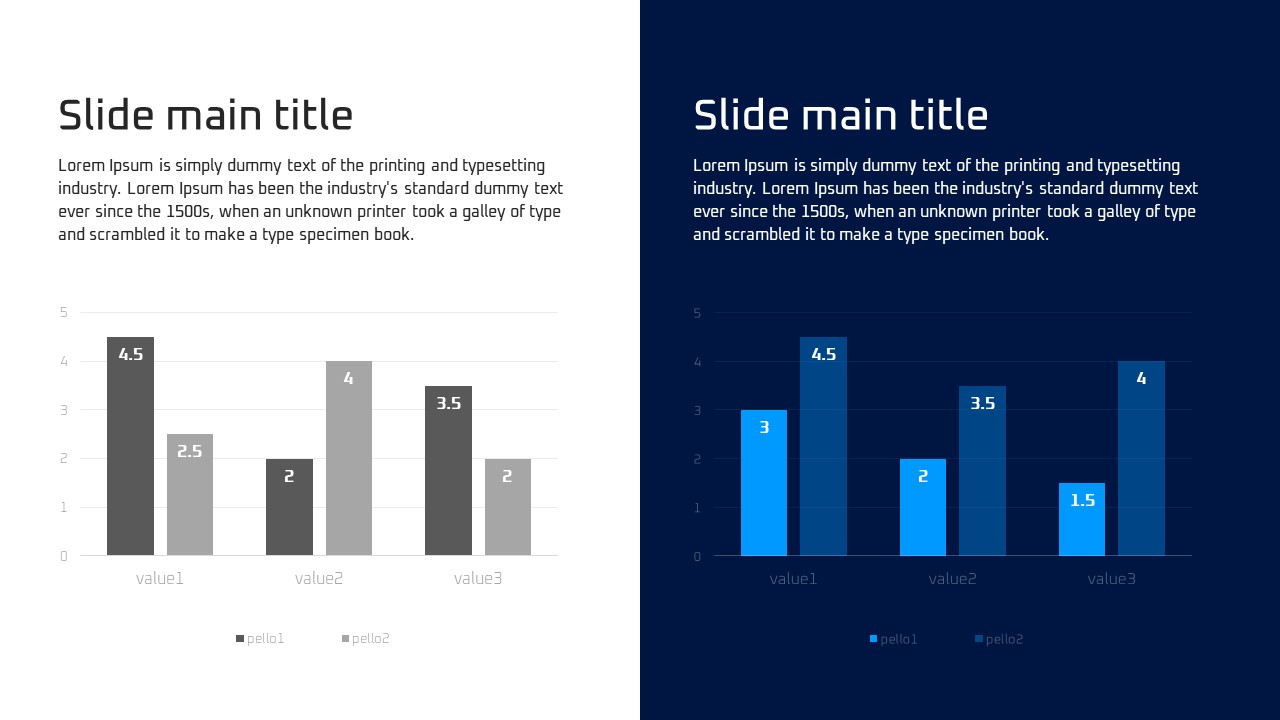
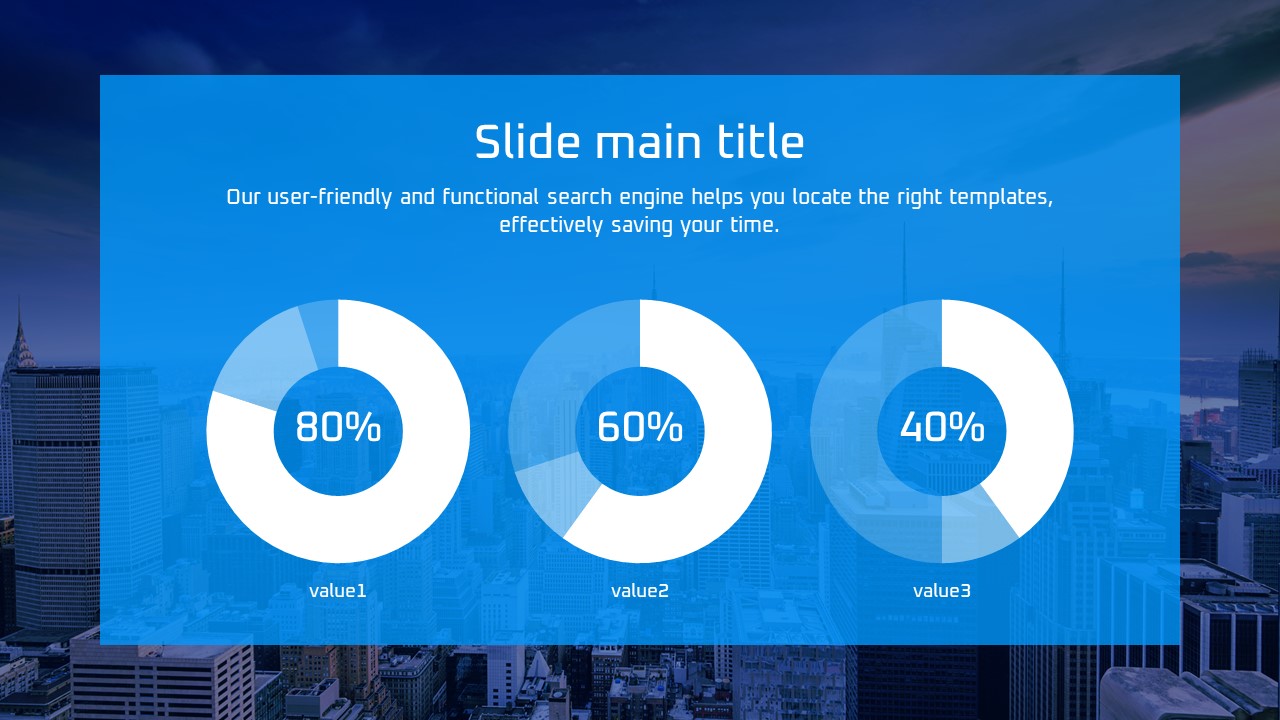
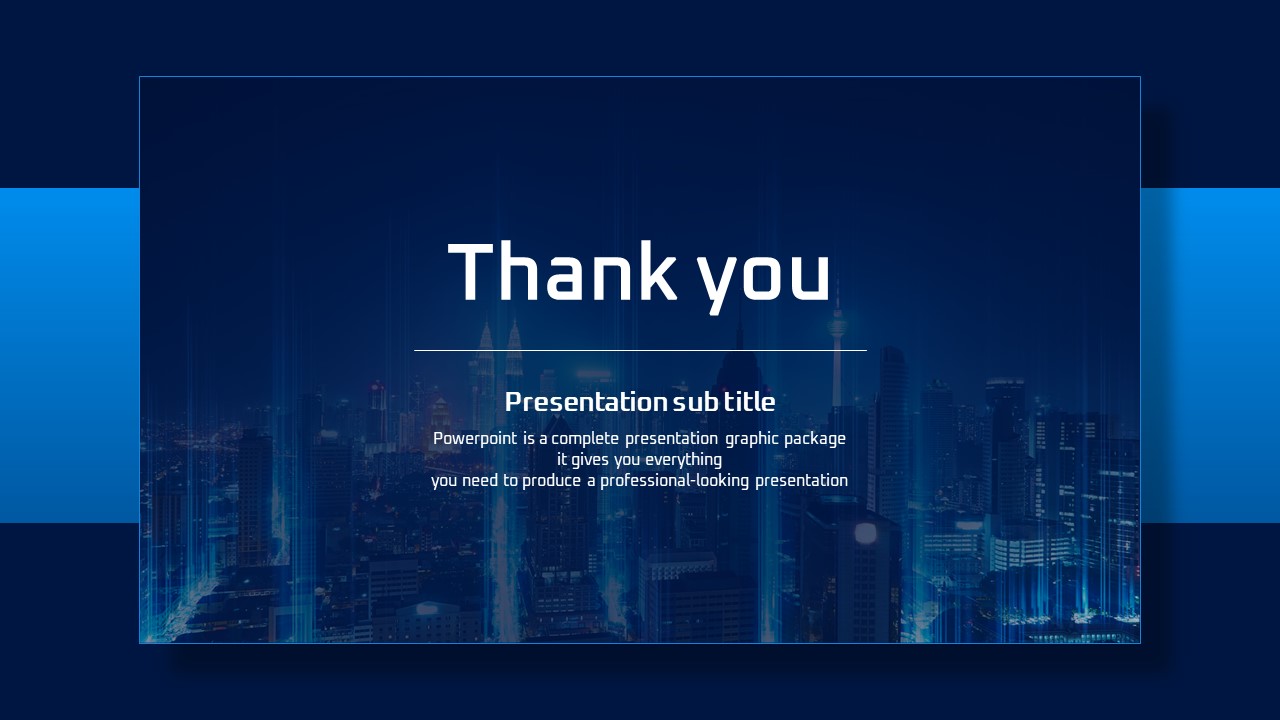
A professional PowerPoint template designed for smart city and urban technology presentations, featuring a deep navy background with royal blue accent colors and white typography. The 30-slide deck includes a full-screen city skyline cover slide, dual-column bar chart data slides, left-right split text-and-photo layouts, numeric emphasis section covers, and three-item line icon list slides. Ideal for smart city project pitches, urban infrastructure investment proposals, and IT solution service presentations. Line icons for smartphone, cloud, and globe are built in, reinforcing a high-tech and trustworthy visual tone. Delivered in fully editable PPTX format, all slides are optimized for 16:9 widescreen display, making it easy to swap text, colors, and images to match your brand.
Usage Points
-
Main Usage
Designed for smart city project pitches, urban infrastructure investment proposals, and IT solution service presentations. The deep navy and royal blue palette conveys technological authority and professionalism to investors and stakeholders.
-
How to Use
Open the PPTX file and replace placeholder text, numbers, and images with your own content. Update the bar chart data and numeric emphasis blocks with your project figures to build a compelling, data-driven presentation in minutes.
-
Recommended For
Smart city project managers, IT infrastructure solution sales and planning teams, urban development investment pitch teams, and public sector digital transformation officers who need a polished, ready-to-use slide deck.
-
Slide Structure
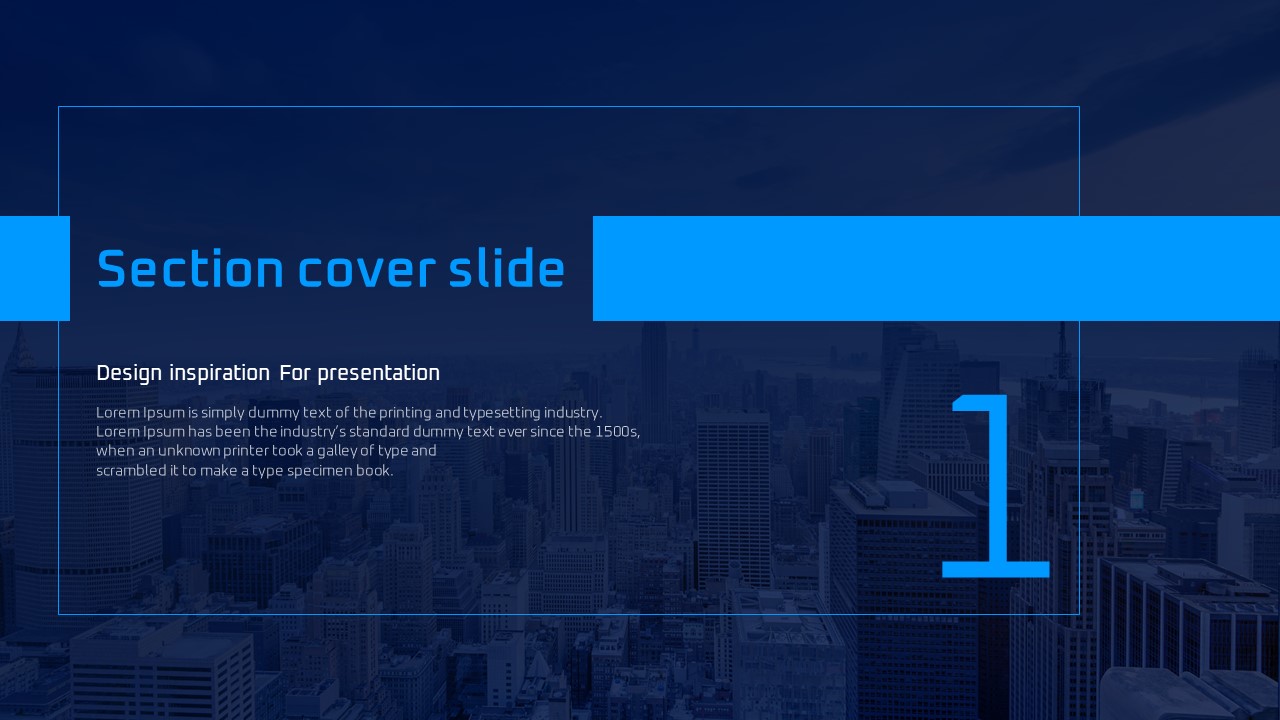
Full-screen city skyline cover → dual-column bar chart data slides → left-right split text-and-photo layouts → three-block numeric emphasis section covers → three-item line icon list slides with city photo backgrounds. Total 30 slides at 16:9.
Related Products
-

Illustrated Folder Presentation Template – Stylish and Practical Design
#Business
-

Business Work Item Presentation Template – Professional Design
#Business
-

Ideas Conference Presentation Template – Stylish Business Design
#Business
-

Business Partnership PowerPoint Template – Build Trust with Elegant Design
#Business
