Setting Business Goals – Intuitive Flow Diagram
RJ0300093_10
- Last Update 05/15/2025
- File Size 1.7MB
- # of Slides 2
- File Format PPTX
- Slide Ratio 16:9
- Color
Keywords
- #Content-Based Slides
- #Design-Based Slides
- #Product/Service Introduction
- #Business Vision and Strategy
- #Diagram
- #Benefits and Advantages
- #Business Goals
- #Flow
- #Multidirectional Flow
- #16:9
- #two-way diagram PowerPoint
- #connection flow chart template
- #business goal setting slide
- #circular node diagram
- #process flow PowerPoint slide
About the Product
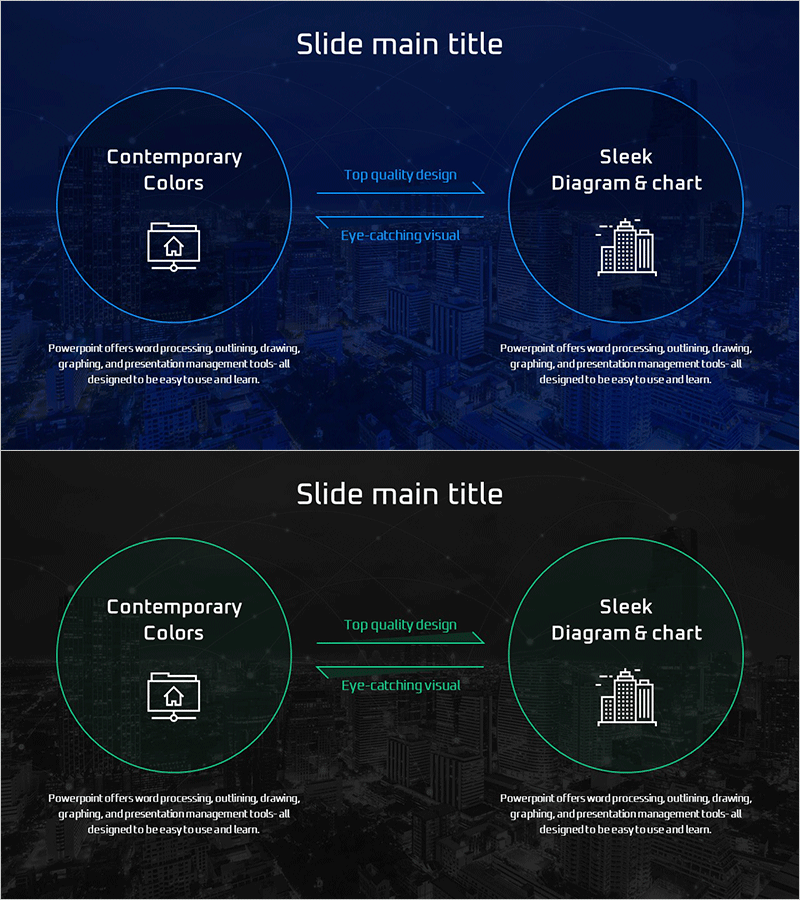
A two-way connection diagram PowerPoint slide designed for business goal setting and strategic planning presentations. The slide features two circular nodes connected by directional arrows, visually representing relationships between cause and effect, input and output, or current state and target state. Set against a dark blue background with bright blue circular borders and white typography, the design ensures high contrast readability. The central connecting arrows and descriptive text clearly illustrate process flow and relationships. Composed of 2 slides in 16:9 widescreen format, each slide can be used independently or as part of a continuous presentation. Built with standard PowerPoint shapes, allowing full customization of colors, text, and node dimensions.
Usage Points
-
Main Usage
Used in business strategy presentations, goal-setting sessions, and process improvement discussions to visualize bidirectional relationships between cause-effect, input-output, and current-target states. Effectively communicates organizational vision pathways, connections between business objectives and execution strategies, and relationships between problems and solutions.
-
How to Use
Edit the text within each circular node to input goals, strategies, or outcomes. Modify the descriptive text above the central arrows to clarify the nature of relationships. Customize colors to distinguish importance levels or categories, and adjust node sizes to represent priorities or relative significance.
-
Recommended For
Ideal for executives, strategic planning teams, project managers, consultants, and educators presenting business goal setting, strategic planning, process improvement, and organizational change initiatives. Suitable for executive briefings, team meetings, client proposals, training seminars, and corporate presentations.
-
Slide Structure
Consists of 2 slides, each featuring two circular nodes positioned on the left and right sides, connected by central directional arrows. Each circular node contains an icon and text input area, with relationship description text positioned above the connecting arrows. The dark blue background combined with bright blue circular borders and white text creates high-contrast visibility for projector presentations.
Related Products
-

Multidirectional Diagram Slide Visualizing Diverse Business Strategies
#Business Vision and Strategy #Business Strategy #Diagram
-

Touch Diagram for Business Strategy Visualization – Clear Flow Communication
#Product/Service Introduction #Business Vision and Strategy #Diagram
-

Emphasizing the Importance of Hydration with a Multidirectional Arrow Diagram
#Product/Service Introduction #Diagram #Text Box
-

Construction Business Partner Collaboration Diagram - Connecting Clients and Partners
#Company Introduction #Product/Service Introduction #Diagram
