AI Business Differentiation Strategy Slide - Perfect Harmony of Design and Data
RJ0300093_5
- Last Update 05/15/2025
- File Size 0.1MB
- # of Slides 2
- File Format PPTX
- Slide Ratio 16:9
- Color
Keywords
- #Content-Based Slides
- #Design-Based Slides
- #Product/Service Introduction
- #Business Vision and Strategy
- #Diagram
- #Graph
- #Differentiation Strategy for Products/Services
- #Business Goals
- #Flow
- #Horizontal Bar
- #Linear Flow
- #Grouped Horizontal Bar
- #16:9
- #horizontal bar chart PowerPoint
- #comparison chart slide
- #data visualization PPT
- #business strategy slide template
- #3-item diagram PowerPoint
About the Product
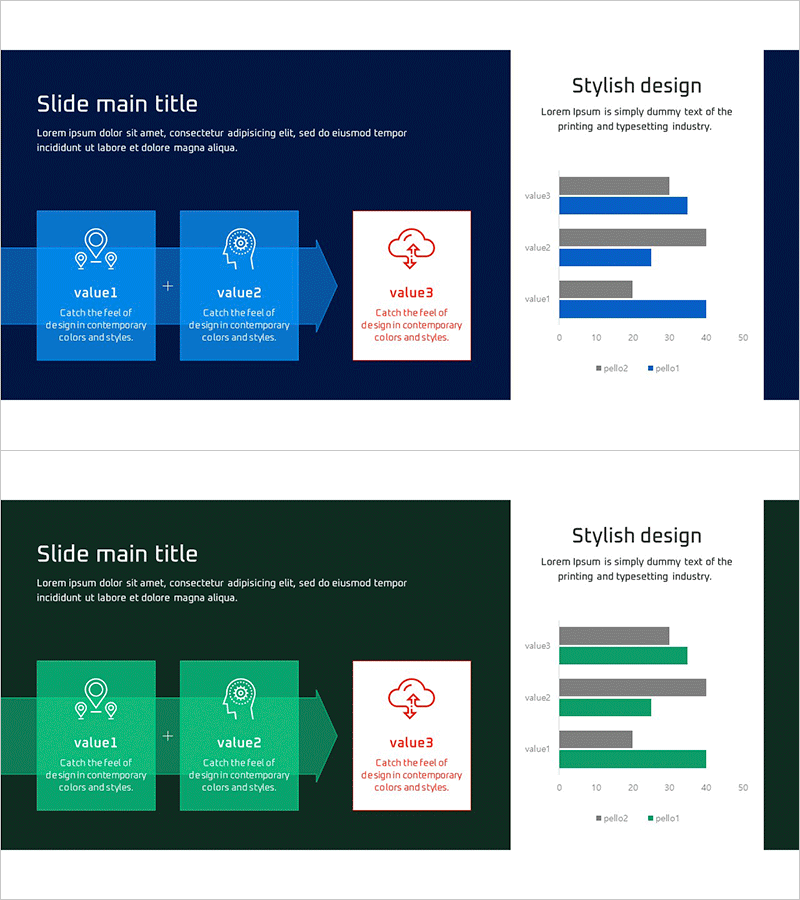
A 2-slide PowerPoint presentation designed for AI business strategy presentations. The left side features a 3-item diagram with icons and sequential flow indicators, while the right side displays a horizontal bar chart comparing three data series with distinct color coding. The dark blue, turquoise, and white color palette ensures clear visual hierarchy and information clarity. Arrow connectors emphasize process flow and relationships. Ready to download and edit immediately as a presentation template, slide deck, or data visualization resource in 16:9 widescreen PPTX format.
Usage Points
-
Main Usage
Visualize multiple data points using a horizontal bar chart while providing conceptual context through a left-side diagram. Ideal for business strategy, performance comparison, and market analysis presentations where quantitative evidence strengthens credibility.
-
How to Use
Slide 1 introduces three core values, strategies, or elements using icons and text boxes connected by arrows. Slide 2 displays the horizontal bar chart with three data series. Replace text labels and numerical values while maintaining the color scheme to adapt the template for different presentation contexts.
-
Recommended For
Executive reports, business plan presentations, marketing strategy meetings, investor pitch decks, quarterly performance reviews. Recommended for executives, strategists, data analysts, and marketing professionals who need data-driven presentation materials.
-
Slide Structure
Slide 1: Dark blue background with 3 input areas (icon + text) and arrow connectors. Slide 2: Horizontal bar chart (3 series, 0–50 scale) on right side with legend on left. Total 2 slides, 16:9 aspect ratio, PPTX format.
Related Products
-

Visualizing Summer Strategy with Diagram Presentation
#Product/Service Introduction #Business Vision and Strategy #Diagram
-

Business Strategy Presentation with Writing Instrument Triangle Diagram
#Product/Service Introduction #Business Vision and Strategy #Diagram
-

Content Order Description Diagram – Innovative Technology and Future Plans
#Product/Service Introduction #Technical Approach #Diagram
-

Arrow Bundle Diagram – Technology Sector and Service Differentiation Strategy
#Product/Service Introduction #Technical Approach #Diagram
