Smart City Mobile Business Area – Insightful Cluster Diagram
RJ0300093_26
- Last Update 05/15/2025
- File Size 0.1MB
- # of Slides 2
- File Format PPTX
- Slide Ratio 16:9
- Color
Keywords
- #Content-Based Slides
- #Design-Based Slides
- #Product/Service Introduction
- #Business Introduction
- #Diagram
- #Composition
- #Business Areas
- #Cluster
- #Closed Cluster Diagram
- #16:9
- #cluster diagram PowerPoint
- #4-item diagram slide template
- #business area classification
- #smart city PowerPoint presentation
- #mobile business slide design
- #PowerPoint diagram slide download
About the Product
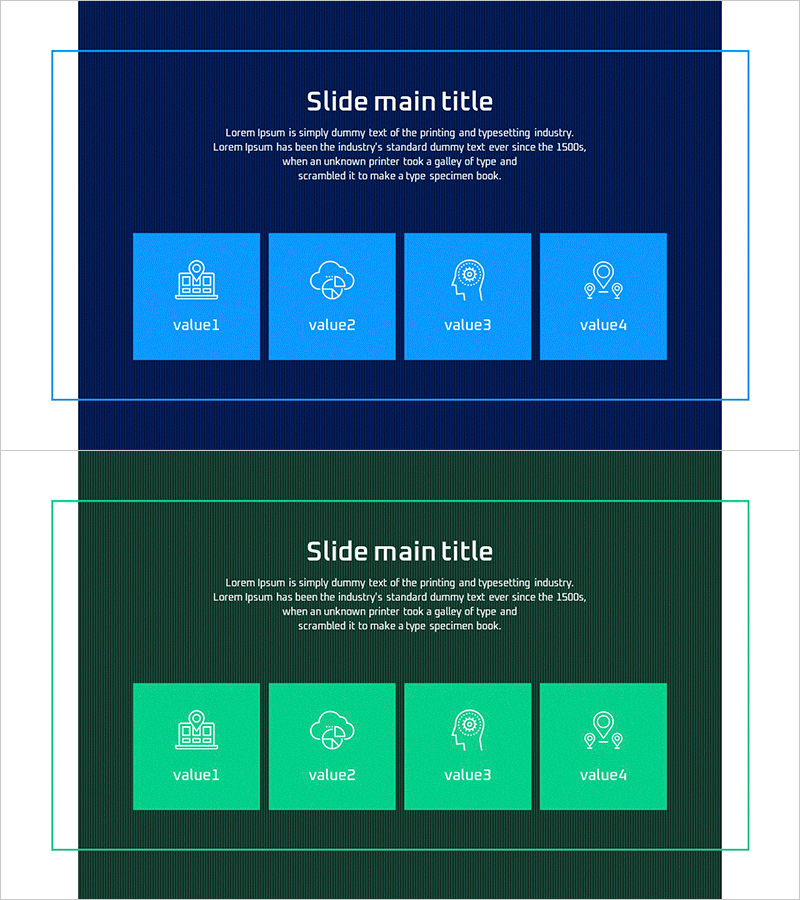
A cluster diagram PowerPoint slide that categorizes smart city and mobile business domains into four key areas. Featuring bright blue boxes with icons arranged on a dark navy background, each box represents a distinct business value proposition. The 2-slide set includes an identical layout version with a dark green background, allowing flexible color selection based on presentation context. Ideal for business portfolio presentations, strategic initiatives, investor relations meetings, and corporate introductions in telecommunications, construction, IT, and smart city solution sectors.
Usage Points
-
Main Usage
Clearly communicates the structure and scope of smart city, mobile, and IoT business portfolios by organizing them into four core domains. Each item's icon (building, cloud, lightbulb, location pin) intuitively represents business characteristics, enhancing audience comprehension and engagement.
-
How to Use
Use in business strategy presentations, investor relations (IR) meetings, and corporate overview presentations within the business domain introduction section. Customize each box's text and icon to match your specific business areas, and select either the dark navy or dark green background version to suit your presentation environment.
-
Recommended For
Telecommunications companies, IT enterprises, construction and real estate developers, smart city solution providers, and mobile service companies. Ideal for executive presentations, business development teams, and marketing departments explaining new business strategies, business diversification, and portfolio restructuring.
-
Slide Structure
2-slide set with dark backgrounds (navy/green) featuring title, description text, and four categorized boxes. Each box uses bright contrasting colors (light blue/lime green) with four distinct icons (building, cloud, lightbulb, location pin) and labels (value1-4). Optimized for 16:9 widescreen format in modern presentation environments.
Related Products
-

Experimental Topic Introduction Diagram – Modern Design Cluster
#Product/Service Introduction #Diagram #Composition
-

Promoting Our Signature Tea: Eye-Catching Slide
#Product/Service Introduction #Diagram #Product/Service Introduction
-

Visualizing Genetic Research Data with a Donut Chart
#Product/Service Introduction #Market and Competitor Analysis #Diagram
-

Detailed Description of Automotive Parts – Innovative Design
#Product/Service Introduction #Diagram #Product/Service Introduction
