City Theme Market Share Graph – Business Data Visualization
RJ0300093_29
- Last Update 05/15/2025
- File Size 2.6MB
- # of Slides 2
- File Format PPTX
- Slide Ratio 16:9
- Color
Keywords
- #Content-Based Slides
- #Design-Based Slides
- #Product/Service Introduction
- #Market and Competitor Analysis
- #Graph
- #Development Status
- #Market Share
- #Circles
- #Doughnut Chart
- #16:9
- #donut chart PowerPoint slide
- #market share analysis template
- #3-segment pie chart
- #business data visualization PowerPoint
- #circular graph slide template
- #how to create donut chart in PowerPoint
About the Product
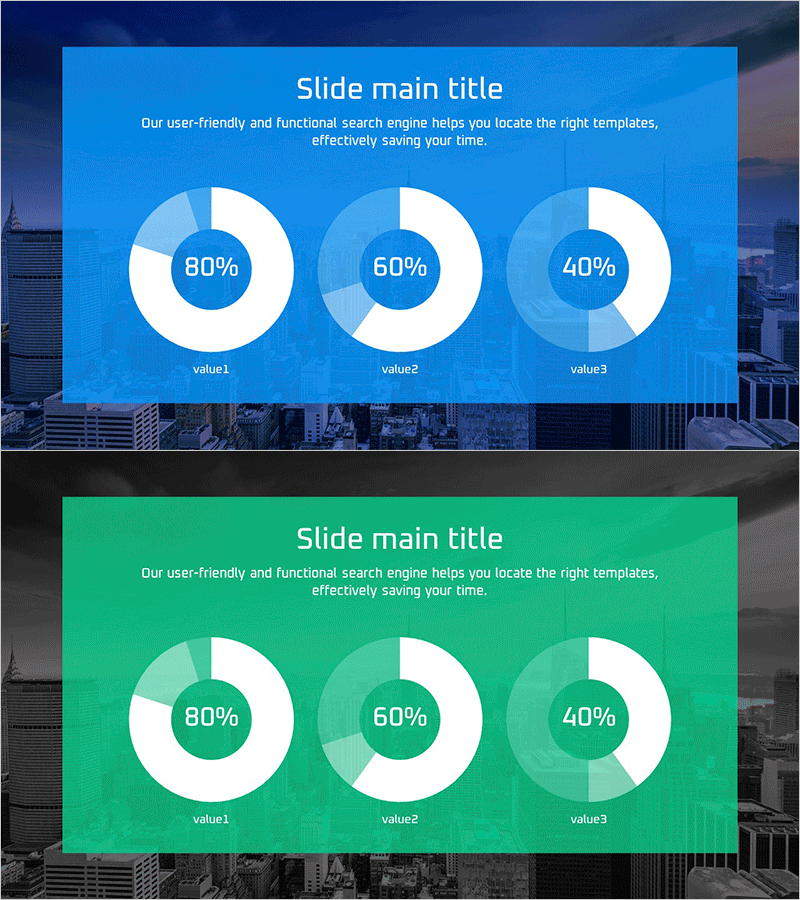
A professional donut chart PowerPoint slide template featuring three data segments for market share analysis and competitive comparison. The design includes two color variations: bright blue and mint green backgrounds with white donut rings displaying percentage values (80%, 60%, 40%) at the center and item labels below. This 2-slide, 16:9 widescreen presentation template enables clear visualization of market share distribution, competitor benchmarking, customer composition, and revenue breakdown. Fully editable and ready for immediate use in business reports and investor presentations.
Usage Points
-
Main Usage
Visualize three-way data distribution such as market share percentages, competitive positioning, customer segments, or revenue allocation using donut ring charts. The hollow center allows for additional text, logos, or icons, while percentage values are prominently displayed for emphasis and clarity.
-
How to Use
Ideal for quarterly business reviews, investor presentations, marketing strategy meetings, and executive dashboards. The blue variant suits technology and IT sectors, while the green variant works well for growth, sustainability, and financial contexts. All colors, percentages, and labels are fully customizable to match your data.
-
Recommended For
Finance teams, marketing departments, sales executives, business analysts, management consultants, and data-driven presenters who need to communicate multi-segment comparisons. Perfect for three-competitor analysis, quarterly revenue composition, customer segmentation, and market penetration reporting.
-
Slide Structure
2-slide set with blue and green background variations. Each slide contains a title area, descriptive text, and three donut charts arranged horizontally. Each chart features a white donut ring, center circle with percentage display, and bottom label. Optimized for 16:9 widescreen format with professional spacing and alignment.
Related Products
-

Analysis graph of market share progress
#Product/Service Introduction #Market and Competitor Analysis #Graph
-

Map Donut Graph for Visualizing Market Share – Symbol of Practicality and Change
#Product/Service Introduction #Market and Competitor Analysis #Graph
-

Stock Market Share Analysis Graph – Insights and Strategies
#Product/Service Introduction #Market and Competitor Analysis #Graph
-

Analysis of Transportation Usage Status – Pie Chart
#Product/Service Introduction #Market and Competitor Analysis #Graph
