Cloud Smart System Target Revenue Setting – Marketing Strategy and Financial Performance
RJ0300093_13
- Last Update 05/15/2025
- File Size 0.1MB
- # of Slides 2
- File Format PPTX
- Slide Ratio 16:9
- Color
Keywords
- #Content-Based Slides
- #Design-Based Slides
- #Marketing Plan and Strategy
- #Financial Plans and Performance
- #Diagram
- #Marketing Objectives
- #Sales and Revenue
- #Flow
- #Table
- #Linear Flow
- #16:9
- #network diagram PowerPoint
- #cloud system presentation slide
- #target revenue setting template
- #marketing strategy diagram
- #financial performance visualization PPT
About the Product
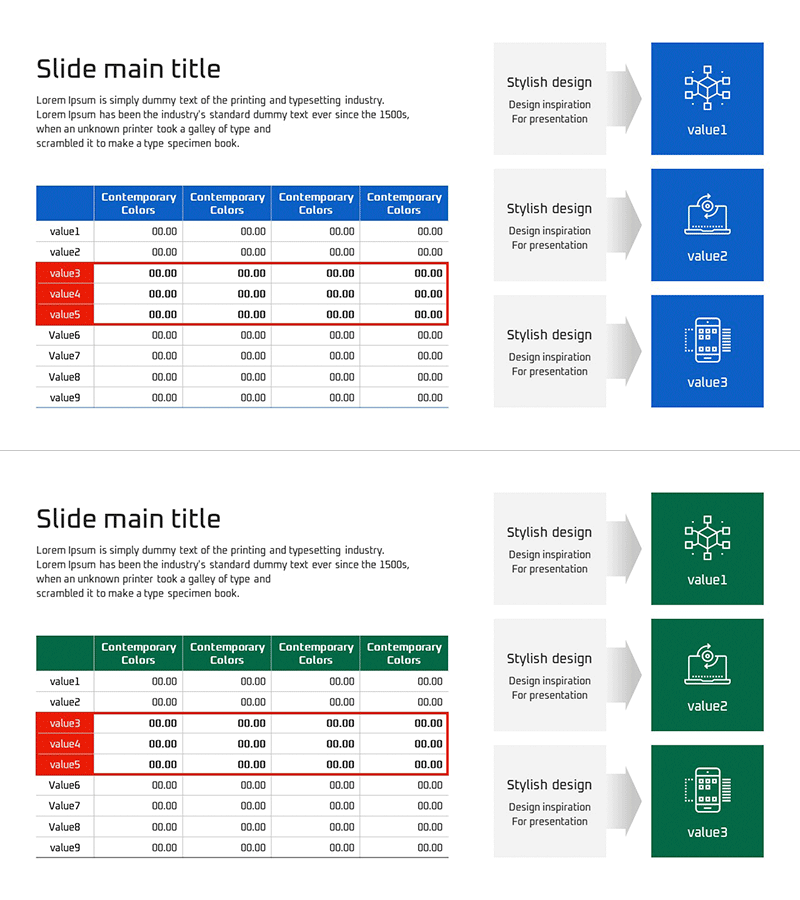
A network connection diagram PowerPoint slide that visualizes cloud smart system target revenue setting and strategic goals. The slide features a central hub node connected to three peripheral nodes representing marketing strategy, financial performance, and system operations. Designed with blue and green dual-tone backgrounds and white icons, this presentation slide clearly communicates data flow and business relationships. The 2-slide set is ready to use in business presentations, strategy meetings, and financial reports.
Usage Points
-
Main Usage
Visualizes cloud-based business system target revenue setting and strategic planning processes. The radial structure with one central goal node and three peripheral strategy nodes (marketing, finance, operations) effectively communicates integrated business objectives and execution pathways.
-
How to Use
Use in executive presentations, strategy planning meetings, and investor pitch decks to explain business goals and strategic relationships. Edit node text to customize with your organization's specific objectives, strategies, and performance metrics.
-
Recommended For
Ideal for marketing managers, financial analysts, executives, management consultants, and business planners presenting strategy development, performance management, and operational planning. Particularly suited for cloud services, SaaS, and digital platform presentations.
-
Slide Structure
2-slide set with first slide featuring blue background network diagram (1 central node + 3 peripheral nodes with white icons) and second slide with green background identical structure. Each node includes text input areas. Formatted in 16:9 widescreen aspect ratio for modern displays.
Related Products
-

Business Idea Goal Summary Table – Visualizing Marketing Strategies Efficiently
#Marketing Plan and Strategy #Financial Plans and Performance #Diagram
-

Sales Outlook Analysis Table – Focus on Market and Financial Performance
#Market and Competitor Analysis #Financial Plans and Performance #Diagram
-

Ranking Highlighting Bar Charts and Tables – Sales and Performance Management
#Financial Plans and Performance #Diagram #Graph
-

Sales Outlook Analysis Chart – Sleek Data Visualization
#Market and Competitor Analysis #Financial Plans and Performance #Diagram
