Table of Contents for Profit Achievement – Visualizing Financial Plans
RJ0300093_6
- Last Update 05/15/2025
- File Size 0.1MB
- # of Slides 2
- File Format PPTX
- Slide Ratio 16:9
- Color
Keywords
About the Product
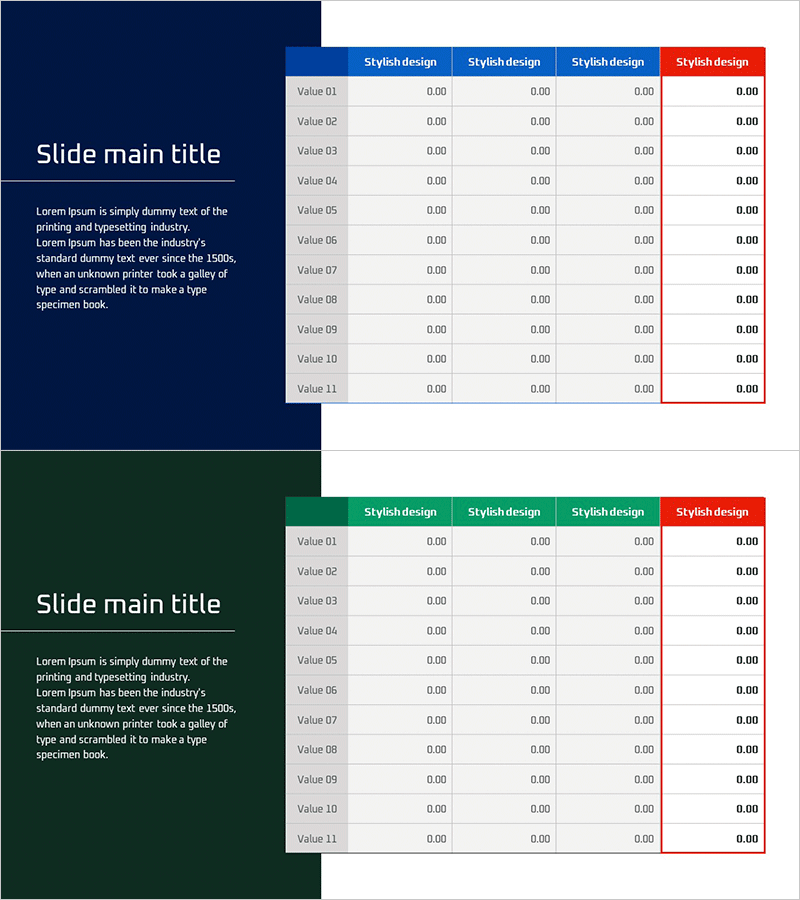
A data table PowerPoint slide designed for financial planning and revenue achievement visualization. This presentation template features a horizontal table structure with 11 rows and 5 columns, enabling systematic organization of numerical information. The layout clearly separates a dark navy background section on the left for title and descriptive text from a white background table area on the right. The header row uses blue and red color coding to emphasize key columns, while each cell accommodates numerical data for visualizing financial status, sales performance, cost analysis, and other metrics. The 2-slide deck provides flexible table layouts optimized for modern 16:9 widescreen presentations.
Usage Points
-
Main Usage
Organize and compare numerical data such as financial plans, sales performance, cost analysis, and performance indicators. The 11-row, 5-column table structure clearly presents period-by-period, department-by-department, or product-by-product numerical comparisons.
-
How to Use
Use in the financial section of presentations, business reports, and investor pitch decks to explain revenue status, sales trends, and cost structures. Input actual figures into each cell and modify header colors as needed to highlight key metrics.
-
Recommended For
Finance managers, CFOs, executives, business planners, and marketing professionals presenting revenue achievement plans, financial status analysis, and sales performance reports. Ideal for quarterly performance reviews, annual business plan presentations, and investor relations meetings.
-
Slide Structure
2-slide layout. Each slide features a dark navy background section on the left for title and descriptive text, with an 11-row×5-column data table on the right. The header row uses blue and red color differentiation to emphasize column titles, while each row accommodates Value 01–11 items and corresponding numerical data.
Related Products
-

Geometry Pattern Wide Table PPT Template for Financial Planning and Performance
#Financial Plans and Performance #Diagram #Balance Sheet
-

Income Statement Table – Effective Tool for Financial Planning
#Financial Plans and Performance #Diagram #Balance Sheet
-

Estimated Balance Sheet Table – Essential for Financial Performance
#Financial Plans and Performance #Diagram #Balance Sheet
-

Comparative Analysis Table Chart for Financial Performance – Trust and Expertise
#Financial Plans and Performance #Diagram #Balance Sheet
