Comparative Analysis Bar Graph – Market and Competitor Analysis
RJ0300093_28
- Last Update 05/15/2025
- File Size 0.1MB
- # of Slides 2
- File Format PPTX
- Slide Ratio 16:9
- Color
Keywords
About the Product
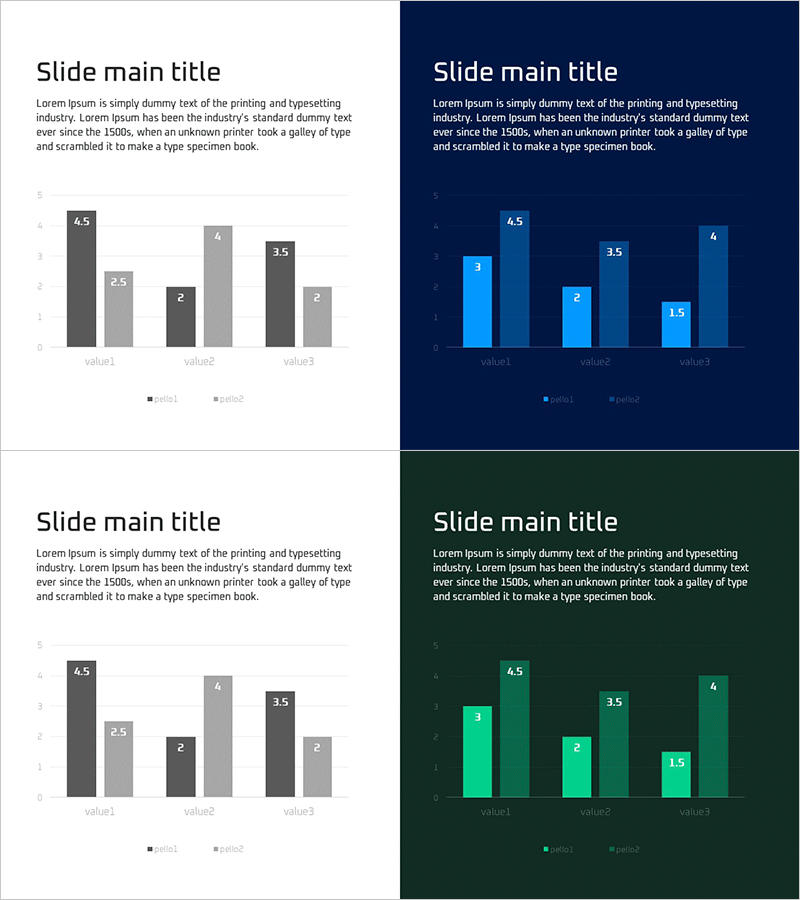
This free PowerPoint slide is perfect for comparing two data sets side by side. The grouped bar chart effectively visualizes market analysis, competitor comparison, and performance benchmarking with three background options—light, dark navy, and dark green—to match your presentation style. Simply replace the category names, series labels, and values to create a professional data visualization slide ready for business plans, reports, proposals, investor pitches, and marketing presentations. The slide is fully editable and requires only text updates to complete. Explore more chart variations and graph templates on GoodPello for comprehensive data visualization solutions.
Usage Points
-
Main Usage
This slide compares two data series across multiple categories to highlight differences and trends clearly. Use it for market size vs. competitor size, year-over-year performance, or solution comparison in business plans, reports, proposals, and investor presentations.
-
How to Use
Replace the category labels (value1, value2, value3), series names (series1, series2), and numerical values with your data. Choose from three background colors—light, dark navy, or dark green—to match your presentation theme.
-
Recommended For
Ideal for business analysts, marketing professionals, financial presenters, and executives preparing market analysis, competitive benchmarking, performance reports, investor pitches, and strategic planning presentations.
-
Slide Structure
Single-slide composition featuring a grouped bar chart with six data points (three categories × two series), complete with Y-axis labels, X-axis category names, legend, and value labels for professional data presentation.
Related Products
-

Competitor Analysis and Market Trend Graph – Blue, Orange, Green Colors
#Free Graphs
-

Market Analysis by Year Horizontal Bar Graph
#Free Graphs
-

Vertical Bar Chart Visualizing Candidate Values – Trends and Choices
#Free Graphs
-

Business Comparison Analysis Graph – Strengthening Market and Competitor Analysis
#Free Graphs
