Income Statement Table Chart – Overview of Financial Planning and Performance
RJ0300093_24
- Last Update 05/15/2025
- File Size 0.1MB
- # of Slides 2
- File Format PPTX
- Slide Ratio 16:9
- Color
Keywords
About the Product
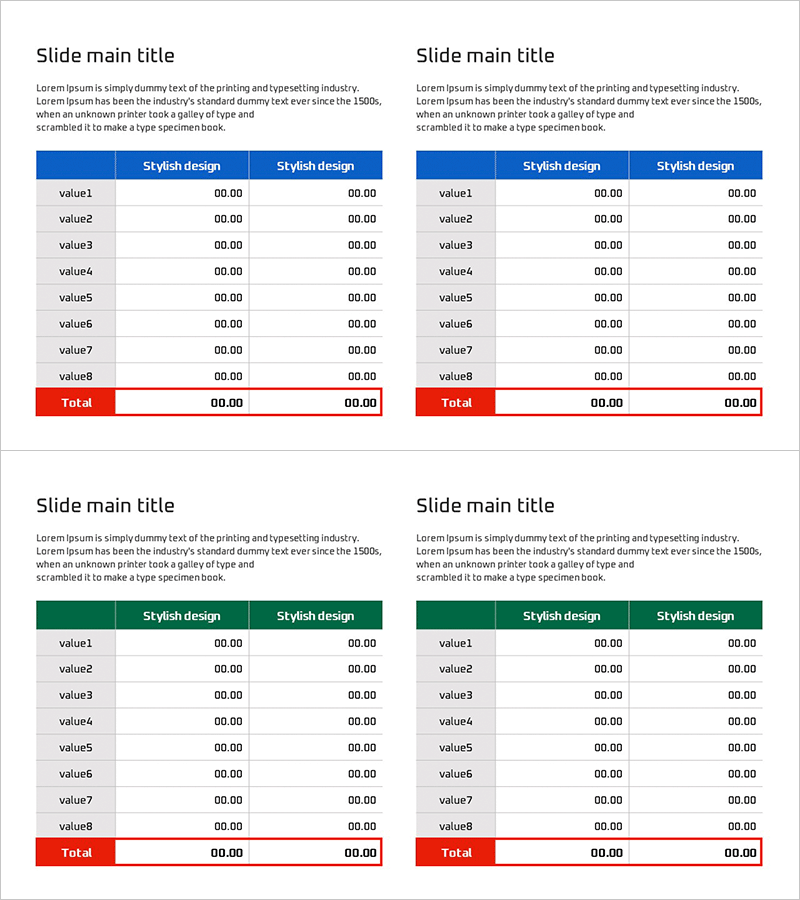
A financial data table PowerPoint slide designed to clearly compare and analyze income statements and performance metrics. This two-column table layout features 8 data rows (value1 through value8) plus a total row, with a gray background on the left and a blue header on the right, allowing simultaneous display of two periods or scenarios. Each slide includes a title area and descriptive text space for immediate use in presentations and reports. Fully editable in PowerPoint format—customize all figures, colors, and labels to match your financial data.
Usage Points
-
Main Usage
Visualize income statement data and financial performance analysis using a structured two-column comparison table format. Present key financial metrics—revenue, expenses, profit—in a clear, organized layout that supports executive decision-making and investor communication.
-
How to Use
Insert into investor presentations (IR decks), business plans, and financial reports in the financial section. Replace placeholder values with actual financial data, and add or remove rows as needed to match your line items. Use the blue and gray headers to distinguish between two reporting periods or scenarios.
-
Recommended For
CFOs, financial analysts, executives, investor relations teams, and business development professionals presenting financial performance. Ideal for income statement summaries, budget planning, financial forecasting, and quarterly/annual performance reviews.
-
Slide Structure
Two-slide set, each featuring a title area, descriptive text space, and a two-column table with blue and gray headers, 8 data rows, and a total row. Formatted in 16:9 widescreen ratio for modern presentation environments.
Related Products
-

Emphasizing Key Row in Table – Essential Tool for Financial Management
#Financial Plans and Performance #Diagram #Balance Sheet
-

Asset & Liability Calculation Table – Optimized for Financial Management
#Financial Plans and Performance #Diagram #Balance Sheet
-

Diagram Table Slide for Financial Performance Analysis
#Financial Plans and Performance #Diagram #Balance Sheet
-

Organizing Insights for Clarity – Emphasizing Financial Planning and Performance
#Financial Plans and Performance #Diagram #Balance Sheet
