Smart City Mobile System Configuration Diagram – Innovation and Connectivity
RJ0300093_27
- Last Update 05/15/2025
- File Size 0.1MB
- # of Slides 2
- File Format PPTX
- Slide Ratio 16:9
- Color
Keywords
- #Content-Based Slides
- #Design-Based Slides
- #Business Vision and Strategy
- #Technical Approach
- #Diagram
- #Core Competencies
- #System Architecture Diagram
- #Structure
- #Tree Diagram
- #16:9
- #tree diagram PowerPoint
- #hierarchical structure slide template
- #system architecture diagram
- #3-level diagram PowerPoint
- #technical presentation template
About the Product
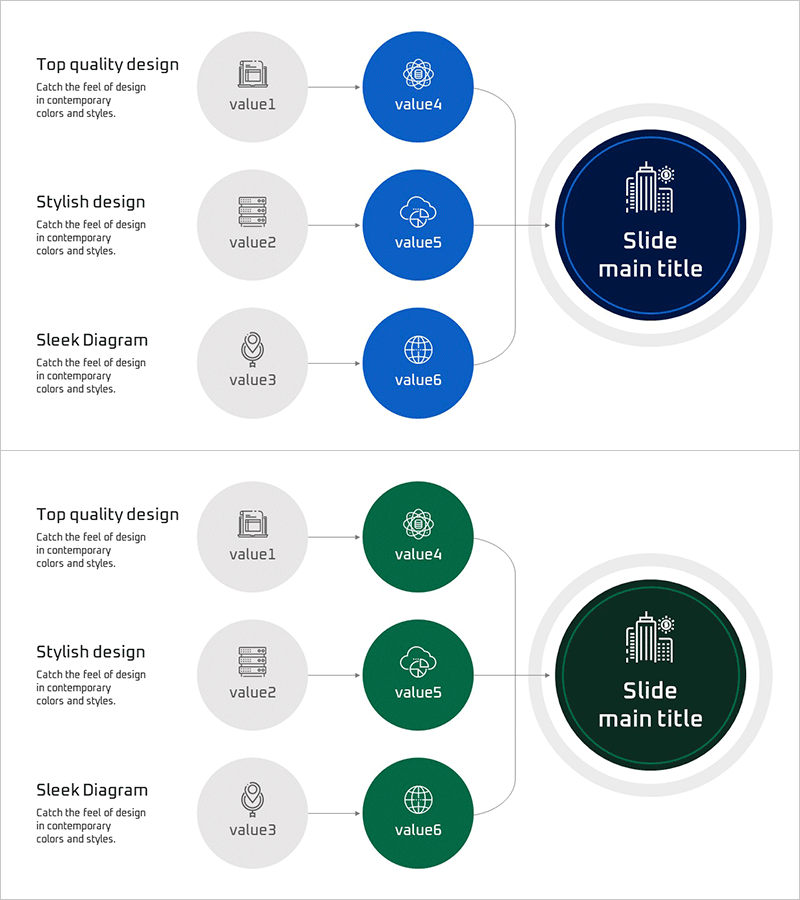
A three-level tree diagram PowerPoint slide designed to visualize smart city and mobile system architecture. The diagram flows from left-side gray nodes through center blue nodes, converging to a large circular hub on the right. Each node features an icon (document, cloud, globe) representing different system components. The white background with blue accent colors conveys technical reliability and system integration. Two-slide set includes identical layouts in both blue and green color schemes for flexible presentation contexts. Delivered in 16:9 widescreen PPTX format, fully editable for immediate use.
Usage Points
-
Main Usage
Effectively visualizes hierarchical system structures and data flow relationships. Ideal for representing smart city platforms, mobile system architectures, cloud infrastructure, organizational hierarchies, and product feature classifications across three tiers. The left-to-right convergence pattern clearly demonstrates cause-and-effect relationships, dependencies, and system integration pathways.
-
How to Use
Insert into the 'Technology' or 'System Architecture' section of technical presentations, business proposals, and system design documents. Customize node text and icons to match your actual system components (sensors, gateways, cloud platforms, etc.). Select the blue version to emphasize technology and reliability, or the green version to highlight sustainability and environmental focus.
-
Recommended For
Ideal for IT companies, startups, telecommunications providers, and smart city solution vendors presenting technical solutions. Recommended for CTOs, technical directors, system architects, and product managers explaining technology roadmaps, system architectures, and data flows. Suitable for investor pitch decks, customer technical briefings, and internal technical training materials.
-
Slide Structure
Two-slide set featuring identical layouts in blue (top) and green (bottom) color schemes. Each slide contains three gray nodes on the left (value1, value2, value3), three colored nodes in the center (value4, value5, value6), and a large circular hub on the right (Slide main title). Connecting lines between nodes clarify hierarchical relationships, while icons in each node enhance visual comprehension and system representation.
Related Products
-

Stress Organization Chart – Effective Team Structure Visualization
#Company Introduction #Technical Approach #Diagram
-

Tree Structure Diagram for Visualizing Business Strategies – System Composition
#Technical Approach #Diagram #System Architecture Diagram
-

Visualizing the Folder Hierarchy and Structure – The Beginning of an Efficient Organization
#Technical Approach #Diagram #Service Architecture Diagram
-

Organizational Structure Analysis - Efficient System Model
#Technical Approach #Diagram #Service Architecture Diagram
