Marketing Strategy Radial Graph
RJ0300093_25
- Last Update 05/15/2025
- File Size 0.1MB
- # of Slides 2
- File Format PPTX
- Slide Ratio 16:9
- Color
Keywords
- #Content-Based Slides
- #Design-Based Slides
- #Business Vision and Strategy
- #Marketing Plan and Strategy
- #Diagram
- #Graph
- #Business Goals
- #Marketing Strategy
- #Cluster
- #Other
- #Closed Cluster Diagram
- #Radar Chart Spider Chart
- #16:9
- #radial diagram PowerPoint
- #5-item radial chart slide
- #marketing strategy PowerPoint template
- #business vision diagram
- #radial graph presentation slide
About the Product
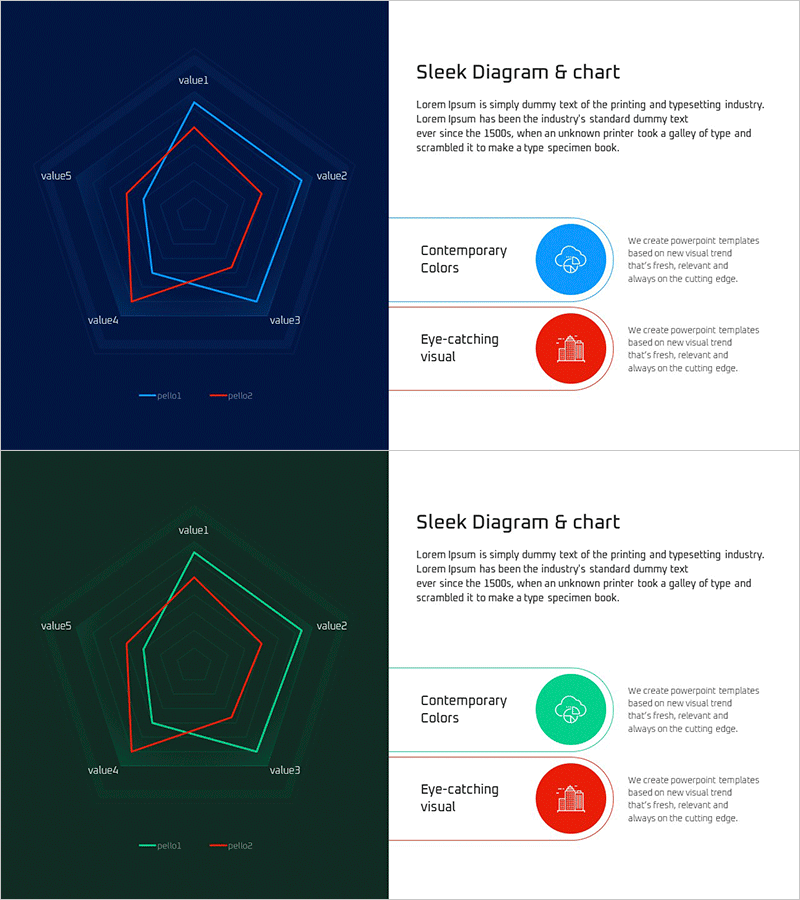
A 5-item radial diagram PowerPoint slide designed to visualize marketing strategies and business vision. The diagram features a central core concept with five items radiating outward on a dark blue background, with red accent lines distinguishing data series. The 2-slide set includes two color themes: dark blue and dark green, each with value1–value5 labels and legend markers (series1, series2). Ideal for comparing marketing objectives, strategic elements, and key performance indicators in professional presentations.
Usage Points
-
Main Usage
The radial structure expresses the relationship and influence of five items around a central concept simultaneously. Use it to illustrate five marketing strategy pillars, five core business values, or five key execution strategies in a way that emphasizes interconnectedness and multi-dimensional analysis.
-
How to Use
Input marketing objectives, strategic elements, or KPIs into each value field. Use the legend (series1, series2) to distinguish data series. Choose between the dark blue or dark green theme based on your presentation context to create a professional, credible business presentation.
-
Recommended For
Ideal for marketing managers, strategy planning teams, and executive reporting. Recommended for business plans, marketing proposals, strategy presentations, investor pitches, and organizational capability assessments where complex multi-factor data needs clear visual communication.
-
Slide Structure
2-slide set. Each slide features five nodes radiating from a central point, labeled value1–value5. Two data series are distinguished by red and blue lines, enabling comparative analysis and supporting multi-dimensional data visualization.
Related Products
-

Development Status Radial Graph – Clarifying Business Vision and Goals
#Product/Service Introduction #Business Vision and Strategy #Diagram
-

Distribution Position Analysis Radial Graph – Visualizing Marketing Strategies
#Marketing Plan and Strategy #Diagram #Graph
-

Smart Healthcare Marketing Strategy Diagram
#Business Vision and Strategy #Marketing Plan and Strategy #Diagram
-

Ringer Shape Subdivided Column Graph – Business Goals & Marketing Strategy
#Business Vision and Strategy #Marketing Plan and Strategy #Diagram
