LOGISTICS INDUSTRY PRESENTATION Template – Stylish and Professional Design
J0300091
- Last Update 08/30/2025
- File Size 47.5MB
- # of Slides 31
- File Format PPTX
- Slide Ratio 16:9
- Color
Slide Preview


Keywords
About the Product
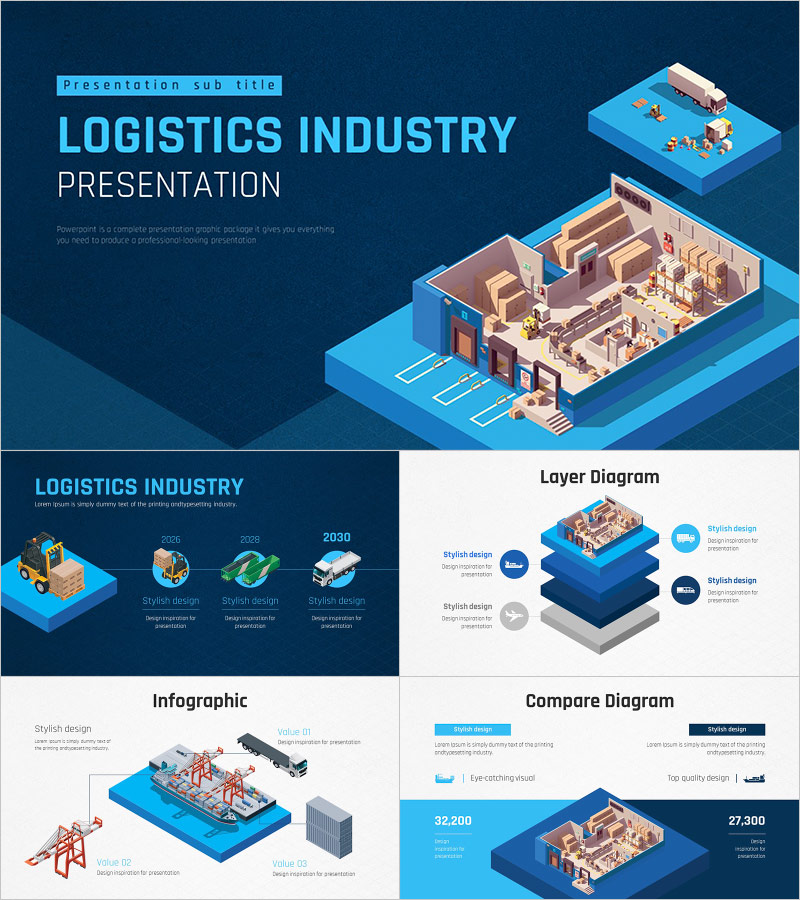
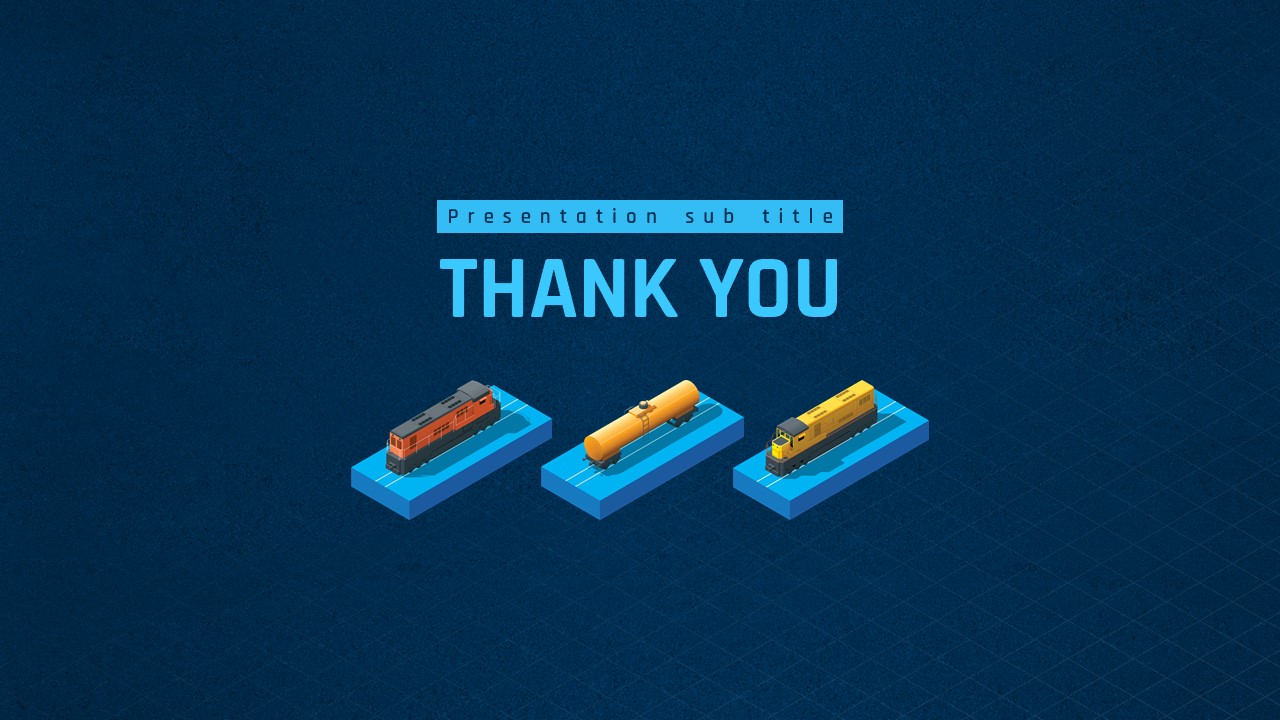
A professional PowerPoint template designed specifically for the logistics industry, featuring isometric 3D illustrations of ports, warehouses, and transportation hubs. Built on a dark navy blue background with sky blue and white accents, this presentation deck delivers a dynamic and authoritative visual tone ideal for supply chain and logistics presentations. The 31-slide set covers every slide type needed for a complete logistics pitch: cover slide, timeline roadmap (2026–2030), layer diagram, infographic, comparison diagram, step diagram, text box cards, and an icon library with over 30 isometric and line icons including trains, forklifts, container ships, aircraft, and trucks. All slides are fully editable in PPTX format, allowing you to replace placeholder text and images with your own data and photos instantly. Whether you are presenting to investors, partners, or internal teams, this template helps you communicate logistics operations and supply chain strategies with clarity and visual impact.
Usage Points
-
Main Usage
Ideal for logistics companies, freight forwarders, and SCM consultants presenting business overviews, service introductions, operational roadmaps, or investment pitches to clients and stakeholders.
-
How to Use
Open the PPTX file, replace the placeholder text and numbers with your actual data, and insert your own site photos into the real-image slide slots. The included isometric icons can be resized and recolored to match your brand palette.
-
Recommended For
Recommended for logistics and distribution company managers, supply chain consultants, startup founders in the freight-tech space, and students preparing logistics-related academic or competition presentations.
-
Slide Structure
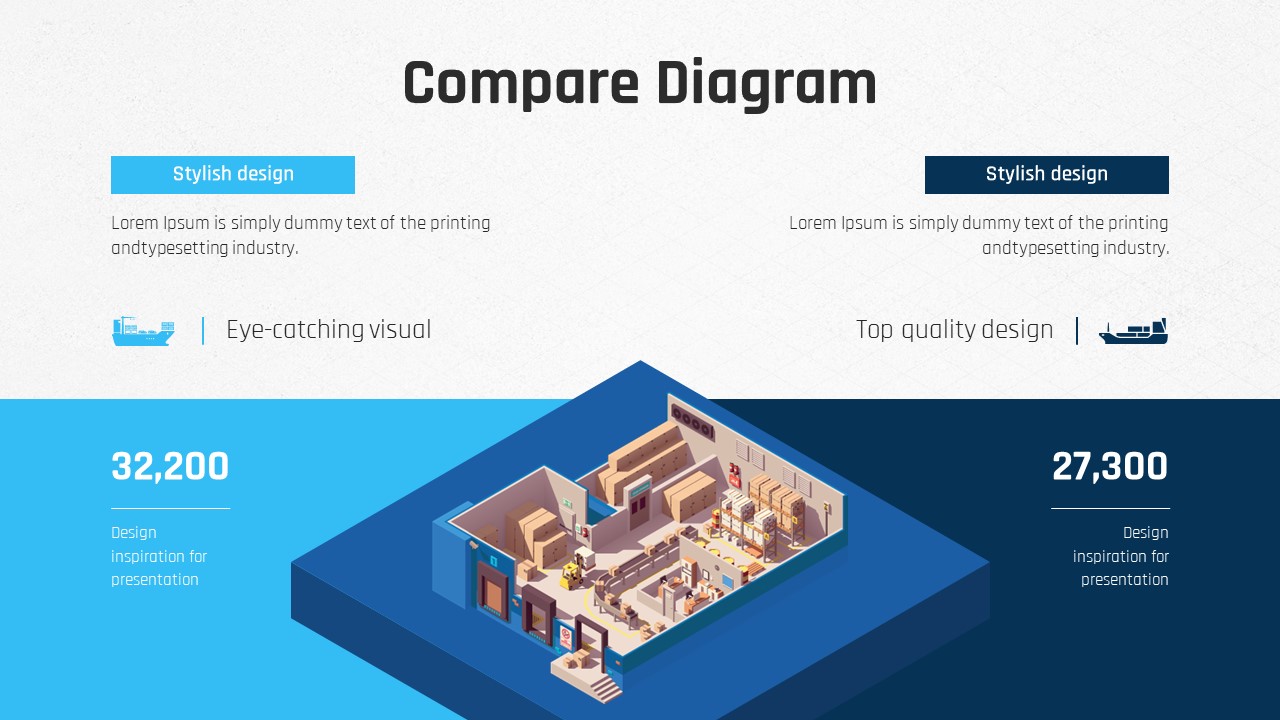
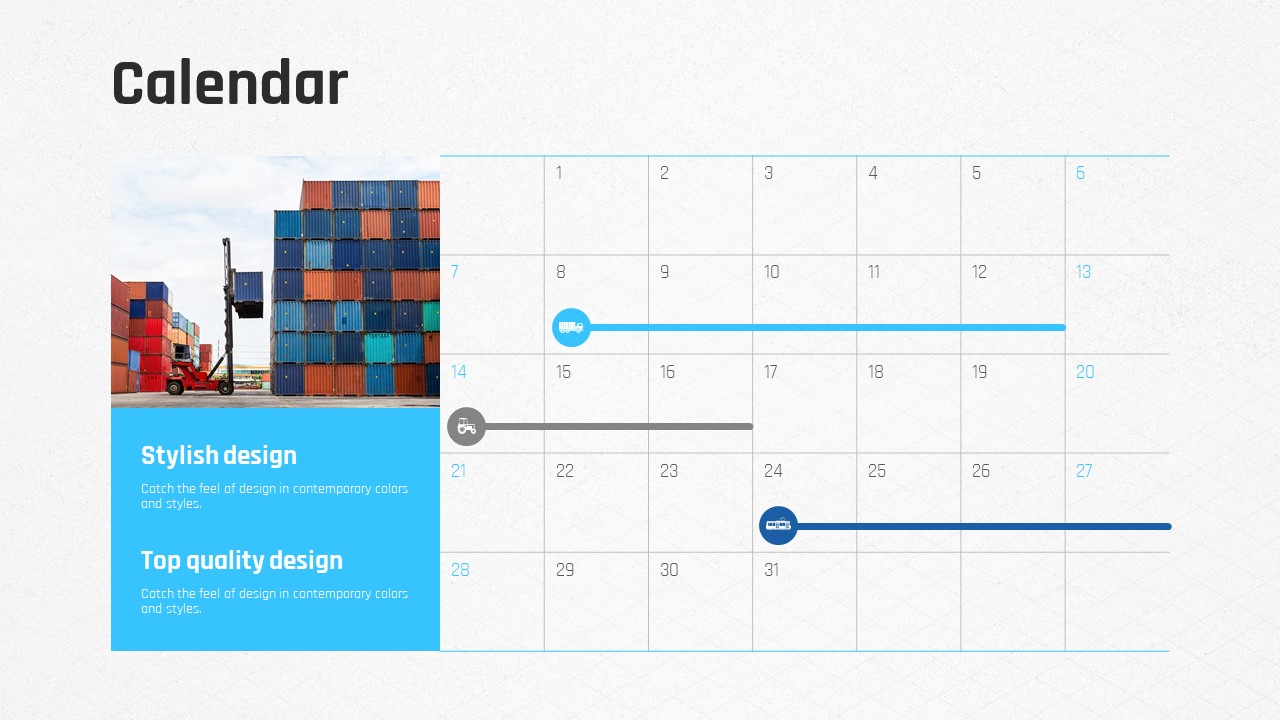
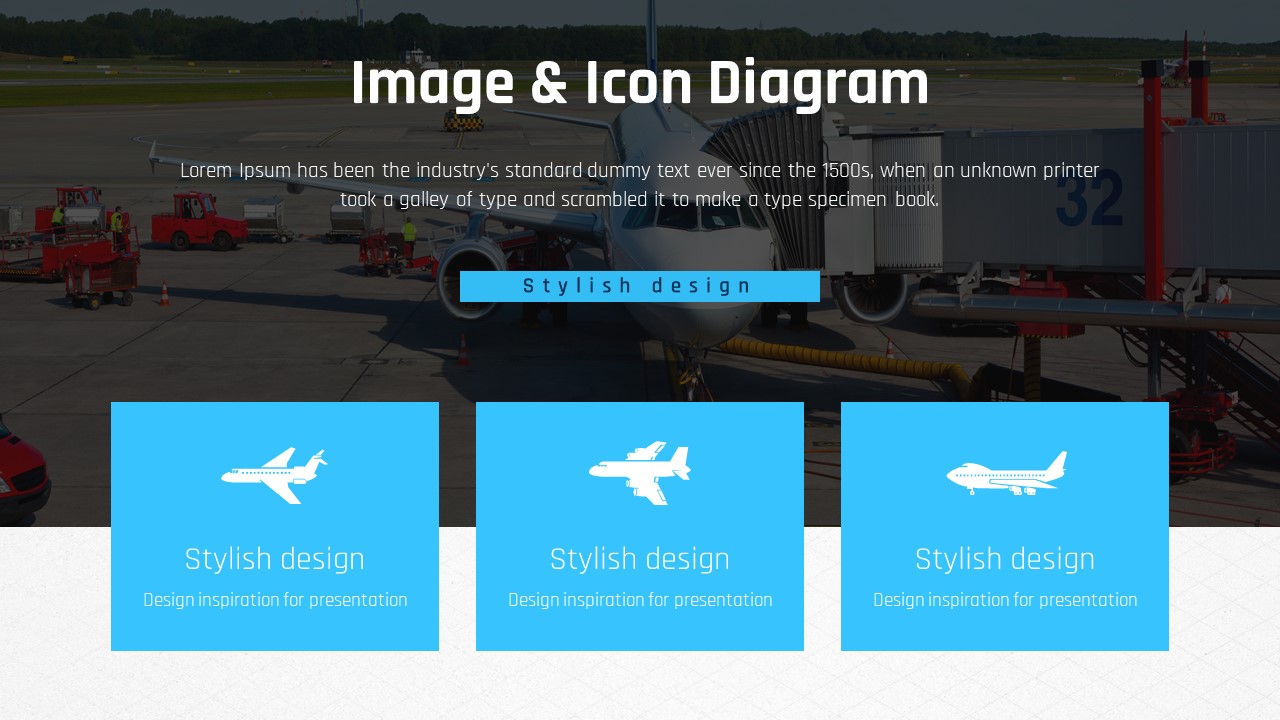
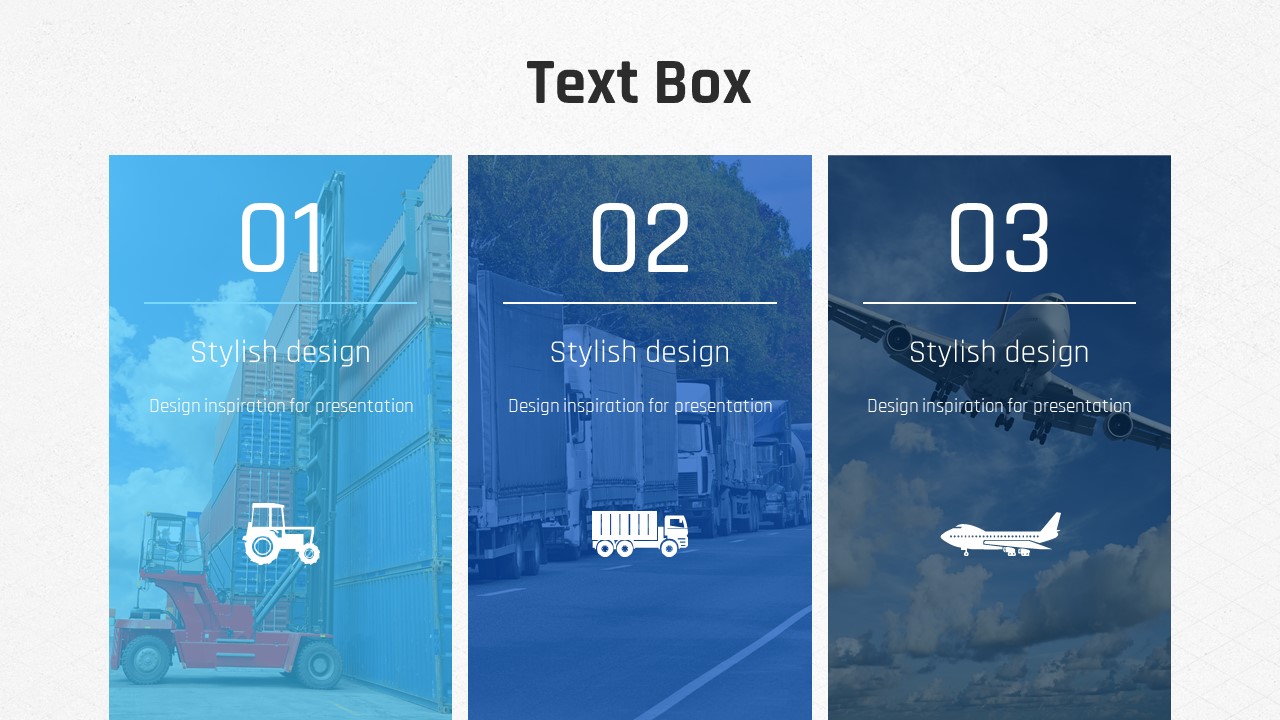
31 slides including a cover, timeline roadmap (2026–2030), layer diagram, infographic with port and truck visuals, comparison diagram with KPI numbers, step diagram with container ship photos, text box cards with aerial transport imagery, and an icon sheet with 30+ isometric and line transport icons.
Related Products
-

Fountain Pen Theme Presentation – Elegant Business Slide Design
#Business
-

Entertainment Company Presentation Template – Stylish and Colorful Design
#Business
-

Office Supplies Presentation Template – Catch Attention with Wide Design
#Business
-

Idea Wide Presentation Template – Modern and Visual Design
#Business
