Smart Area Analysis Graph – Market and Competitor Analysis Tool
RJ0300091_19
- Last Update 05/14/2025
- File Size 3.8MB
- # of Slides 2
- File Format PPTX
- Slide Ratio 16:9
- Color
Keywords
- #Content-Based Slides
- #Design-Based Slides
- #Market and Competitor Analysis
- #Graph
- #Other
- #Competitor Analysis
- #Market Analysis
- #16:9
- #stacked area chart PowerPoint
- #multi-layer data visualization slide
- #market analysis PowerPoint template
- #competitor analysis graph
- #how to create area chart in PowerPoint
About the Product
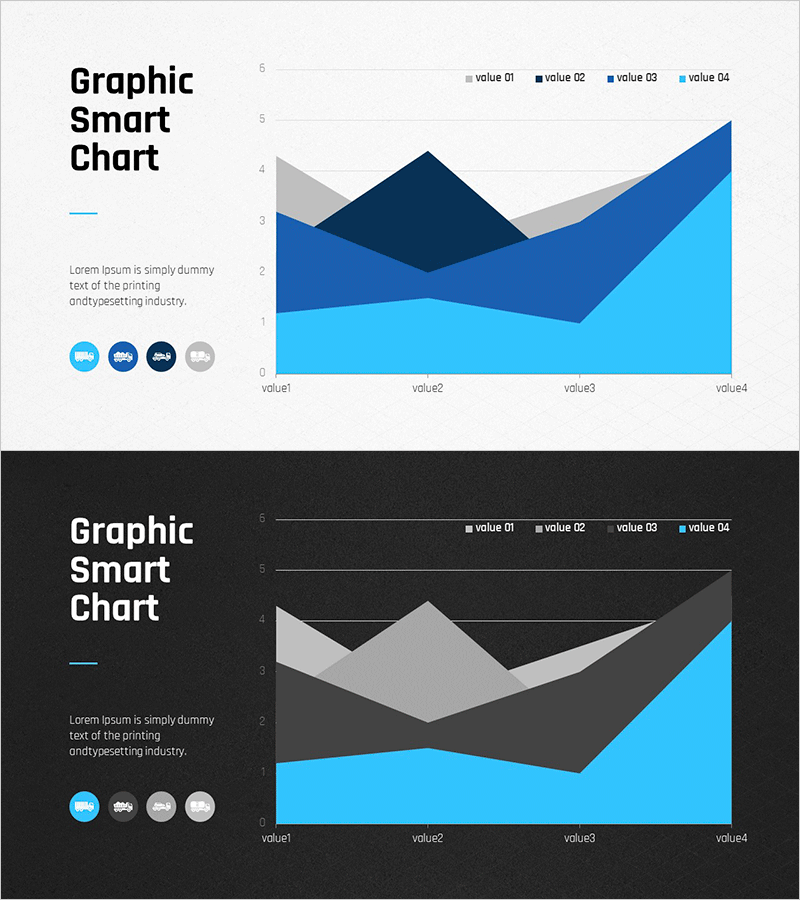
A stacked area chart PowerPoint slide designed for market and competitor analysis presentations. The multi-layered visualization uses light blue, dark blue, and gray tones to display four data series across four time periods, making it easy to compare trends and market share simultaneously. This 16:9 widescreen 2-slide set includes both light and dark background versions for flexible presentation environments. Ideal for IR decks, business reports, and strategic planning documents where quantitative data analysis drives decision-making.
Usage Points
-
Main Usage
Visualize market trends, competitive market share, and revenue progression over time using a four-layer cumulative area chart. This slide simultaneously displays total market size and individual segment proportions, providing clear visual evidence for strategic decisions.
-
How to Use
Insert into investor presentations, quarterly business reports, or marketing strategy documents to illustrate market dynamics and competitive positioning. Use the light version for standard presentations and the dark version for low-light environments or modern design preferences.
-
Recommended For
Strategy teams, marketing departments, finance teams, and executives presenting market analysis to board members, investors, or business partners. Recommended for any data-driven presentation requiring multi-series trend comparison.
-
Slide Structure
Each slide features a left panel with title, descriptive text, and four circular icons, paired with a right-side chart area. The stacked area graph displays four data layers (value 01-04) across four horizontal segments, with legend and Y-axis scale for numerical clarity.
Related Products
-

Space Theme Area Graph – Market and Competitor Analysis
#Market and Competitor Analysis #Graph #Other
-

Visualizing Bar Graphs with PC Mockups – Competitive Market Analysis Tool
#Market and Competitor Analysis #Graph #Other
-

Petcare Area Chart – Visualizing Market Analysis
#Market and Competitor Analysis #Graph #Other
-

Three-Dimensional Graph Analysis – Market and Competitor Analysis Slide
#Product/Service Introduction #Market and Competitor Analysis #Marketing Plan and Strategy
