Vertical Bar Cluster Analysis Graph – Market and Competitor Analysis
RJ0300091_7
- Last Update 05/14/2025
- File Size 2.7MB
- # of Slides 2
- File Format PPTX
- Slide Ratio 16:9
- Color
Keywords
About the Product
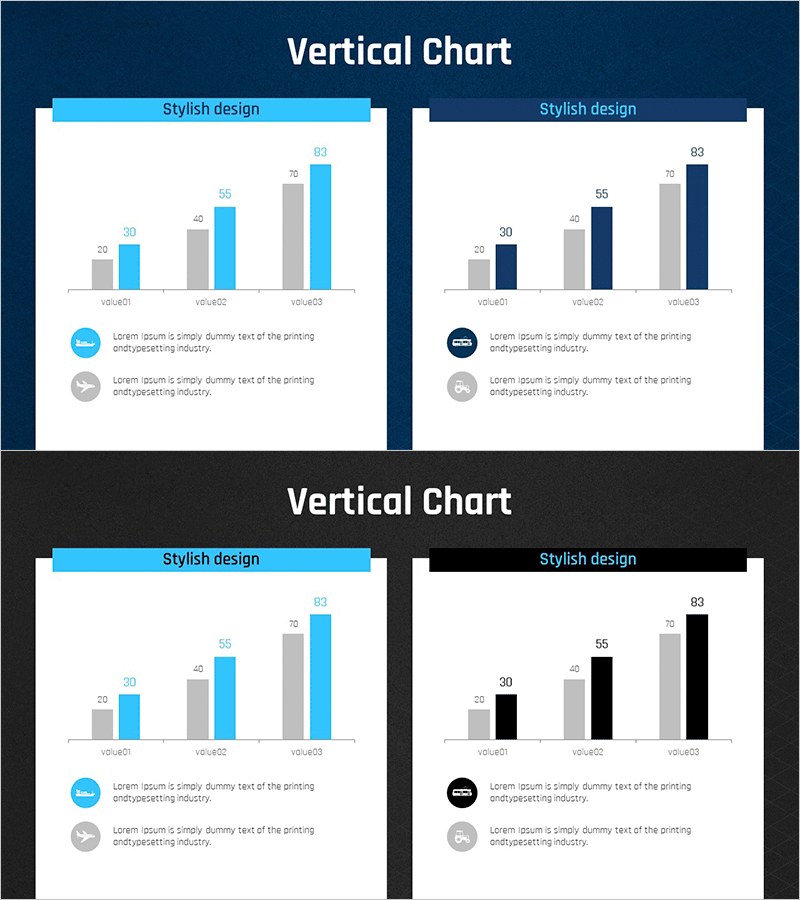
A vertical bar cluster chart PowerPoint slide optimized for market analysis and competitor comparison. This presentation template displays 2-3 data series across 3 categories (value01, value02, value03) side-by-side, enabling quick numerical comparison and trend identification. The light blue and dark navy color scheme emphasizes professionalism, with descriptive text and icons positioned below each chart for clear insight delivery. The 2-slide set accommodates multiple backgrounds (dark blue, black) and allows immediate data input for presentation use.
Usage Points
-
Main Usage
Compare 3+ categories across 2-3 data series such as market size, competitor performance, or departmental results. Bar heights intuitively represent numerical differences, making it ideal for decision-support materials and strategic presentations.
-
How to Use
Replace value01, value02, value03 labels and bar values with actual data. Update legend icons and descriptive text to clarify the analysis context. Select either dark blue or black background to match your overall presentation tone, then insert into your slide deck.
-
Recommended For
Marketing professionals, executives, consultants, and analysts presenting market conditions, competitive positioning, or performance metrics. Suitable for business plans, quarterly reports, investment proposals, and strategy meeting materials requiring data-driven arguments.
-
Slide Structure
Each slide features a header section (light blue or dark navy background) and central chart area. Three categories × 2-3 data series are displayed as vertical bars arranged side-by-side. Below the chart are 2 legend icons and 2 lines of descriptive text. The set includes 2 slides with color variations.
Related Products
-

Market Competitor Analysis with Clustered Vertical Bar Chart
#Market and Competitor Analysis #Graph #Competitor Analysis
-

Table chart & Clustered Column Graph – Market Analysis & Competitor Comparison
#Market and Competitor Analysis #Diagram #Graph
-

Earth Analysis Bundle Vertical Bar Graph – Market and Competitor Analysis
#Market and Competitor Analysis #Graph #Competitor Analysis
-

Vertical Bar Chart Slide for Effective Data Visualization
#Market and Competitor Analysis #Graph #Competitor Analysis
