Graph of Analysis of Transportation Development Status
RJ0300091_10
- Last Update 05/14/2025
- File Size 5.7MB
- # of Slides 2
- File Format PPTX
- Slide Ratio 16:9
- Color
Keywords
- #Content-Based Slides
- #Design-Based Slides
- #Product/Service Introduction
- #Market and Competitor Analysis
- #Graph
- #Development Status
- #Market Share
- #Circles
- #Doughnut Chart
- #16:9
- #donut pie chart PowerPoint
- #3-segment pie chart slide
- #transportation analysis template
- #circular graph presentation
- #how to create pie chart in PowerPoint
About the Product
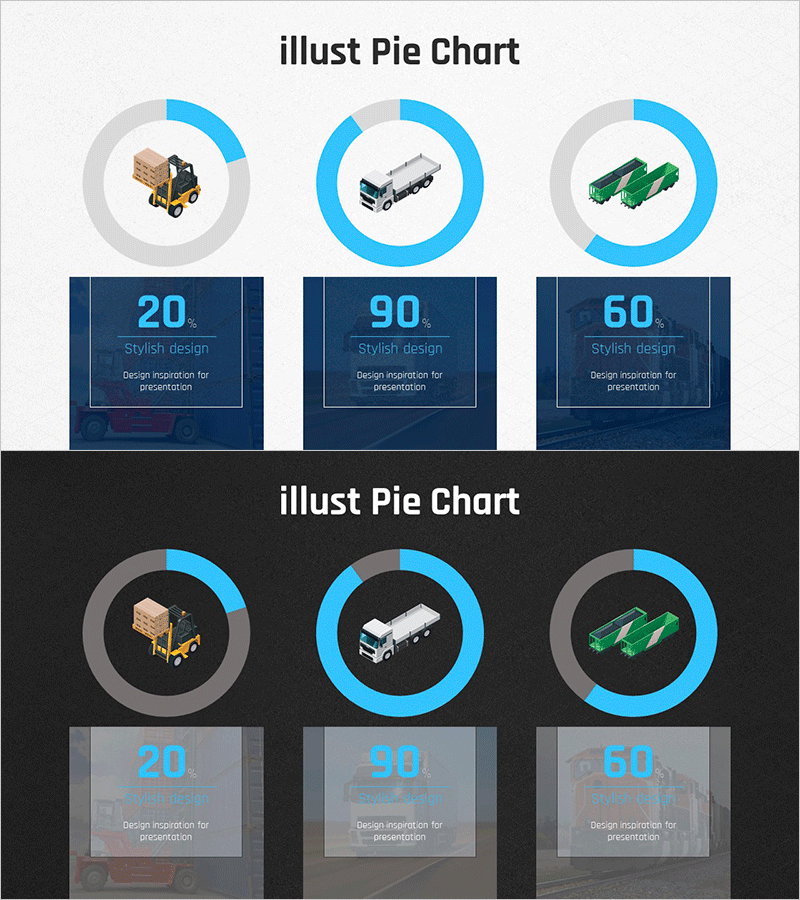
A donut-shaped pie chart PowerPoint slide designed for comparing and analyzing transportation development status across three distinct categories. The visual design features a blue and gray donut chart with category-specific icons (forklift, truck, vehicle) positioned above each segment to enhance visual comprehension and audience engagement. The layout accommodates numerical data and descriptive text for each category, making it immediately applicable to market analysis presentations, competitive benchmarking reports, and development status communications. The slide structure supports easy data customization while maintaining professional visual hierarchy. Provided in 16:9 widescreen format with 2 complete slide variations: one with a light background for standard presentations and one with a dark background for premium atmosphere and evening presentations. Ideal for business reports, investor pitches, and strategic planning sessions.
Usage Points
-
Main Usage
Visualize the proportional composition of three transportation categories at a glance using a donut-shaped chart format. Effectively communicates development status, market share distribution, and competitive comparison data while maintaining visual clarity and professional appearance.
-
How to Use
Replace the sample numbers (20, 90, 60) with your actual data values and edit the descriptive text boxes below each icon. Use the light background version for standard business presentations and reports, and the dark background version for evening events or premium-atmosphere presentations.
-
Recommended For
Transportation and logistics professionals, market analysts, business development managers, and executives preparing status reports. Particularly effective for quarterly development analysis, competitive benchmarking presentations, and investor relations materials.
-
Slide Structure
Two donut pie chart variations with 3 segments each (light and dark backgrounds). Each segment includes an icon (forklift, truck, vehicle), numerical data label, and descriptive text box. Blue accent areas contrast against gray backgrounds for visual emphasis and clarity.
Related Products
-

Analysis graph of market share progress
#Product/Service Introduction #Market and Competitor Analysis #Graph
-

City Theme Market Share Graph – Business Data Visualization
#Product/Service Introduction #Market and Competitor Analysis #Graph
-

Business Idea Development Status Graph – Ideas and Growth
#Product/Service Introduction #Market and Competitor Analysis #Graph
-

Doughnut Chart Visualizing Current Status of 3D Printing Technology Development
#Product/Service Introduction #Market and Competitor Analysis #Graph
