Competitor Comparison Analysis Diagram
RJ0300091_18
- Last Update 05/14/2025
- File Size 4MB
- # of Slides 2
- File Format PPTX
- Slide Ratio 16:9
- Color
Keywords
About the Product
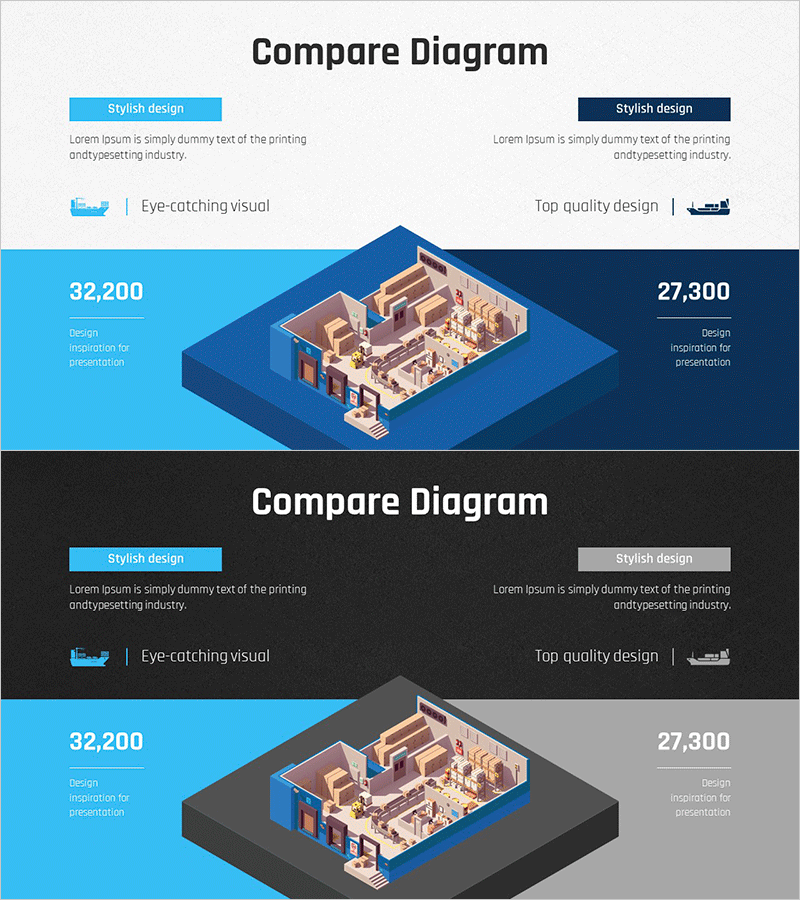
A two-panel contrast-style PowerPoint slide that enables clear side-by-side comparison of your company against competitors. The left panel features light blue background while the right panel uses dark navy, distinctly separating each company's characteristics. A central 3D isometric building visualization adds visual impact and reinforces the comparison narrative. Each section accommodates text descriptions, icons, and numerical data, making it ideal for investor presentations, business proposals, and market analysis reports. Provided in 16:9 widescreen PPTX format with fully editable colors and text elements.
Usage Points
-
Main Usage
Visually articulate competitive differentiation strategy and emphasize market positioning advantage. The left-right contrast layout simultaneously displays both companies' strengths, weaknesses, and characteristics, enabling persuasive competitive narrative delivery to investors, partners, and customers.
-
How to Use
Input company information (name, logo, strengths, metrics) in the left panel and competitor data in the right panel. Add text boxes, icons, and charts to specify comparison dimensions such as pricing, technology, market share, and customer satisfaction. The central 3D image can be removed or replaced with alternative visual assets as needed.
-
Recommended For
Ideal for competitive advantage sections in business plans, investor decks, proposals, and market analysis reports. Suited for executives, investors, sales teams, and marketing professionals presenting competitive strategy, market entry plans, product launches, and partnership negotiations where differentiation messaging is critical.
-
Slide Structure
Two-slide set with each slide featuring a header section (title, description, icons), central 3D isometric visualization, and left-right data zones (text boxes, numerical values, characteristic indicators). Light blue, dark navy, and gray background variations enable flexible comparison scenarios and multiple use cases.
Related Products
-

Neon Tone Competitor Analysis Broken Line Graph
#Market and Competitor Analysis #Graph #Competitor Analysis
-

Business Bi-level Bar Graph – Optimized for Competitor Analysis
#Market and Competitor Analysis #Graph #Competitor Analysis
-

Science Component Comparison Slide – Effective Data Delivery Through Visual Comparison
#Operational Plan #Market and Competitor Analysis #Text Box
-

Research Analysis Vertical Bar Chart
#Market and Competitor Analysis #Graph #Competitor Analysis
