Blue Black Table – Financial Performance Visualization
RJ0300091_17
- Last Update 05/14/2025
- File Size 2.6MB
- # of Slides 2
- File Format PPTX
- Slide Ratio 16:9
- Color
Keywords
About the Product
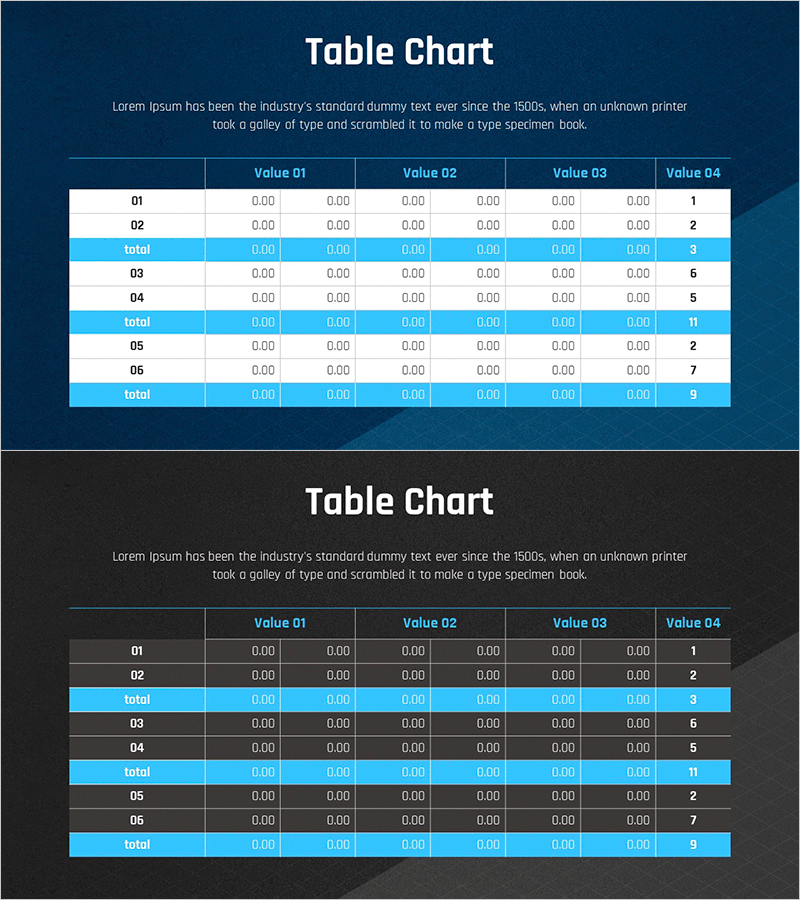
A professional table chart slide with dark blue and black tones for presenting financial data, income statements, and sales performance. The slide features a 3-section structure with subtotal rows for hierarchical data analysis. Simply download for free, replace the numbers and labels with your own data, and insert it directly into your PowerPoint presentation. Perfect for investor reports, executive meetings, quarterly performance reviews, and business presentations. Easy to edit and ready to use immediately with a polished, professional appearance.
Usage Points
-
Main Usage
Display and compare financial performance, income statements, sales figures, and departmental results in a clear row-and-column structure for analysis and reporting.
-
How to Use
Replace row labels (01-06) and column headers (Value 01-04) with your data categories, then input your numerical values into the cells. Subtotal rows can be set to auto-calculate.
-
Recommended For
Finance professionals, executives, investor relations managers, and business analysts who need to present numerical performance data in reports and presentations.
-
Slide Structure
Single-slide design with dark blue background featuring a 7-column (row label + 4 value columns + total) × 9-row (6 data rows + 3 subtotal rows) table structure.
Related Products
-

Basic Revenue Model Diagram – Foundations of Operations and Marketing Strategy
#Free Diagrams
-

Quality Assurance Plan Diagram – Step-by-Step Flow for Business Execution
#Free Diagrams
-

Free Donut Chart PowerPoint Template | Soft Rounded Circular Graph Diagram
#Free Diagrams
-

Free Challenges & Achievements Record History Slides
#Free Diagrams
