Graph of Analysis of Transportation Use Status - Market Competition Analysis
RJ0300091_15
- Last Update 05/14/2025
- File Size 4.2MB
- # of Slides 2
- File Format PPTX
- Slide Ratio 16:9
- Color
Keywords
- #Content-Based Slides
- #Design-Based Slides
- #Market and Competitor Analysis
- #Graph
- #Competitor Analysis
- #Market Analysis
- #Horizontal Bar
- #Horizontal Bar Chart
- #16:9
- #horizontal bar chart PowerPoint
- #bar graph slide template
- #transportation analysis chart
- #market competition analysis slide
- #comparative data visualization PPT
About the Product
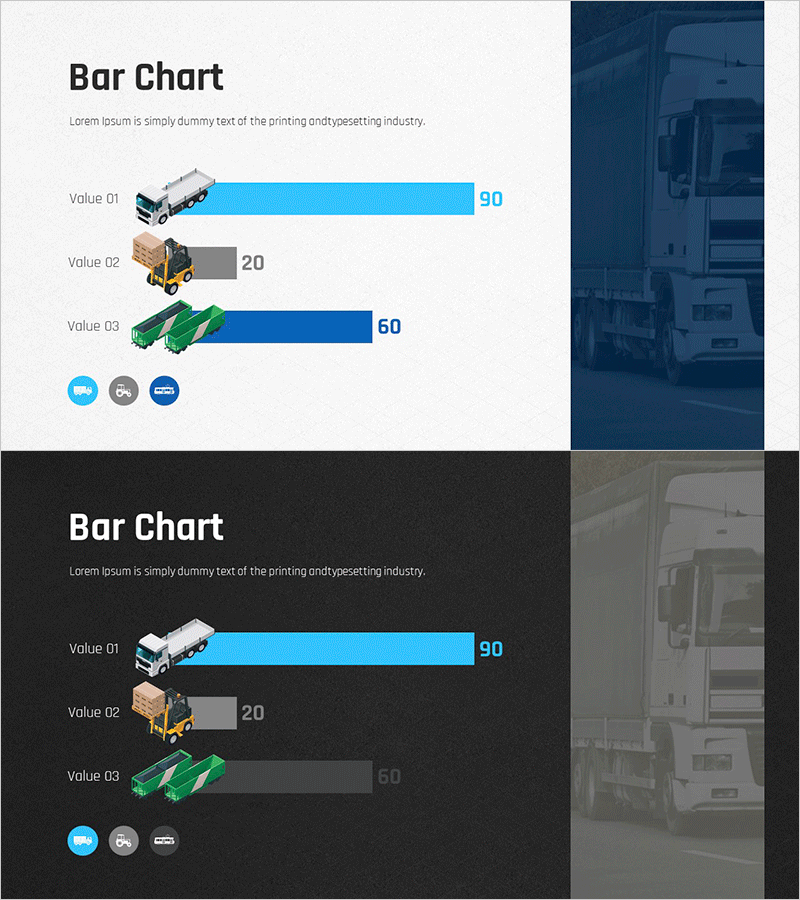
A horizontal bar chart PowerPoint slide comparing transportation usage across three categories with quantitative data visualization. The design features transportation icons (truck, forklift, cargo vehicle) on the left side of each bar, with blue and gray bars displaying values (90, 20, 60) against a light gray background. Two versions are included: a light background variant for daytime presentations and a dark background variant for evening displays or screen projection. Ideal for market analysis reports, logistics strategy presentations, competitive benchmarking, and data-driven business decision-making in transportation and supply chain contexts.
Usage Points
-
Main Usage
Designed to compare three transportation-related metrics or market segments using horizontal bar representation. The bar length intuitively conveys relative magnitude differences, while icons provide immediate visual context for each category. Numeric labels (90, 20, 60) enable precise data communication.
-
How to Use
Suitable for executive briefings, market analysis presentations, industry benchmarking reports, logistics and supply chain strategy meetings, and competitive analysis sessions. Use the light background version for printed materials and daytime presentations; deploy the dark background version for evening events or digital screen displays.
-
Recommended For
Logistics and transportation professionals, market analysts, business consultants, strategy planners, sales executives, and supply chain managers who need to present quantitative comparisons and support strategic decisions with data visualization.
-
Slide Structure
Two-slide set. Each slide contains a title area, three horizontal bars (Value 01–03) with corresponding numeric values, left-aligned transportation icons, and bottom legend icons. Light version uses white background with blue and gray bars; dark version uses black background with blue and dark gray bars for contrast.
Related Products
-

Competitor Growth Comparison Chart – Essential Slide for Market Analysis
#Market and Competitor Analysis #Graph #Competitor Analysis
-

Gradient Bar Graph Presentation – Market Competitiveness Analysis
#Market and Competitor Analysis #Graph #Competitor Analysis
-

Competitive Hotel Service Comparison Analysis Diagram
#Market and Competitor Analysis #Graph #Competitor Analysis
-

Stylish Bar Chart Slide Design
#Market and Competitor Analysis #Diagram #Graph
