Logistics Industry Progress Analysis Graph – Market Insight
RJ0300091_23
- Last Update 05/14/2025
- File Size 7.5MB
- # of Slides 2
- File Format PPTX
- Slide Ratio 16:9
- Color
Keywords
- #Content-Based Slides
- #Design-Based Slides
- #Market and Competitor Analysis
- #Graph
- #Competitor Analysis
- #Market Analysis
- #Horizontal Bar
- #Horizontal Bar Chart
- #16:9
- #horizontal bar chart PowerPoint
- #logistics industry slide template
- #data comparison chart
- #market analysis graph
- #how to create bar chart in PowerPoint
About the Product
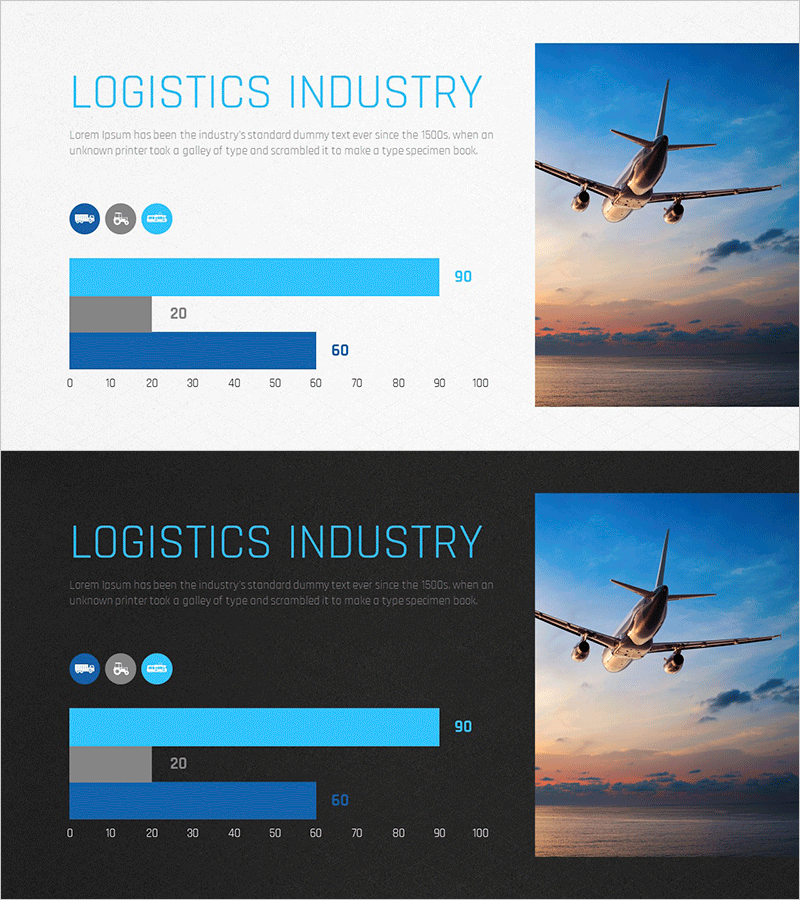
A horizontal bar chart PowerPoint slide designed for logistics industry market analysis presentations. Provided in two layout versions—light background and dark background—with light blue, gray, and dark blue bars representing three comparable data points. The 0-100 horizontal scale and clear numerical labels enable visualization of progress metrics, market share, competitive positioning, and industry benchmarks. An aircraft image reinforces logistics and transportation sector expertise. Delivered in 16:9 widescreen PPTX format, fully editable and ready to customize with your data.
Usage Points
-
Main Usage
Present quantitative logistics data—market size, market share, growth rates, competitive metrics—with clear visual comparison across three categories. The side-by-side bar layout makes relative magnitude differences immediately apparent, and the 0-100 normalized scale suits standardized performance metrics and industry benchmarks.
-
How to Use
Double-click the bars and labels to edit values and text directly in PowerPoint. Select the light background version for daytime presentations and reports, or the dark background version for evening events and high-contrast displays. Maintain the color scheme while replacing the aircraft image to adapt the slide for other transportation or supply chain sectors.
-
Recommended For
Ideal for logistics, transportation, and aviation professionals presenting quarterly performance reports, market analysis, executive briefings, and investor presentations. Particularly effective for competitive benchmarking, industry trend analysis, and data-driven decision-making discussions.
-
Slide Structure
2-slide set. Slide 1: Light gray background with three horizontal bars (light blue, gray, dark blue) on 0-100 scale, numerical labels (90, 20, 60), aircraft image positioned right. Slide 2: Identical structure with dark charcoal background. 16:9 widescreen, PPTX format.
Related Products
-

Gradient Bar Graph Presentation – Market Competitiveness Analysis
#Market and Competitor Analysis #Graph #Competitor Analysis
-

Stylish Bar Chart Slide Design
#Market and Competitor Analysis #Diagram #Graph
-

Competitive Hotel Service Comparison Analysis Diagram
#Market and Competitor Analysis #Graph #Competitor Analysis
-

Mobile SNS Market Analysis Graph – Visualizing Competitor Analysis Data
#Market and Competitor Analysis #Diagram #Graph
