
Stock Template Wide – Stylish Business Design
J0300083
- Last Update 07/18/2025
- File Size 16.7MB
- # of Slides 30
- File Format PPTX
- Slide Ratio 16:9
- Color
Slide Preview


Keywords
About the Product
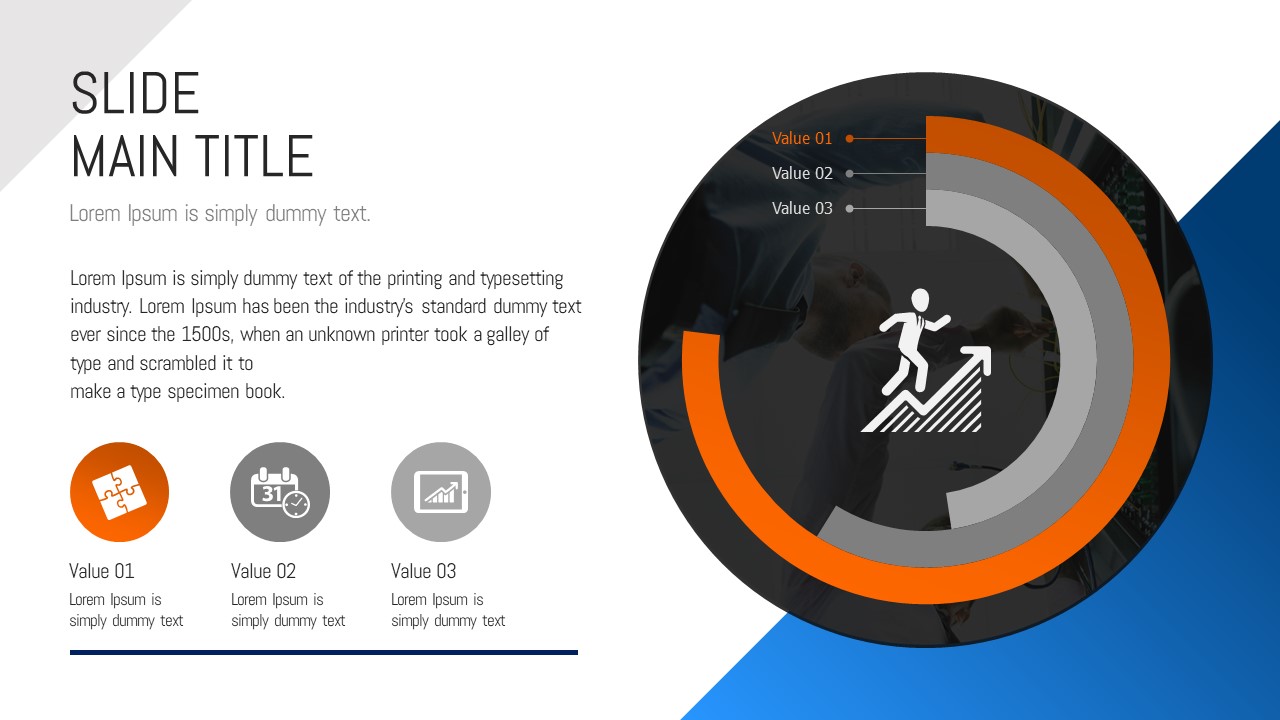
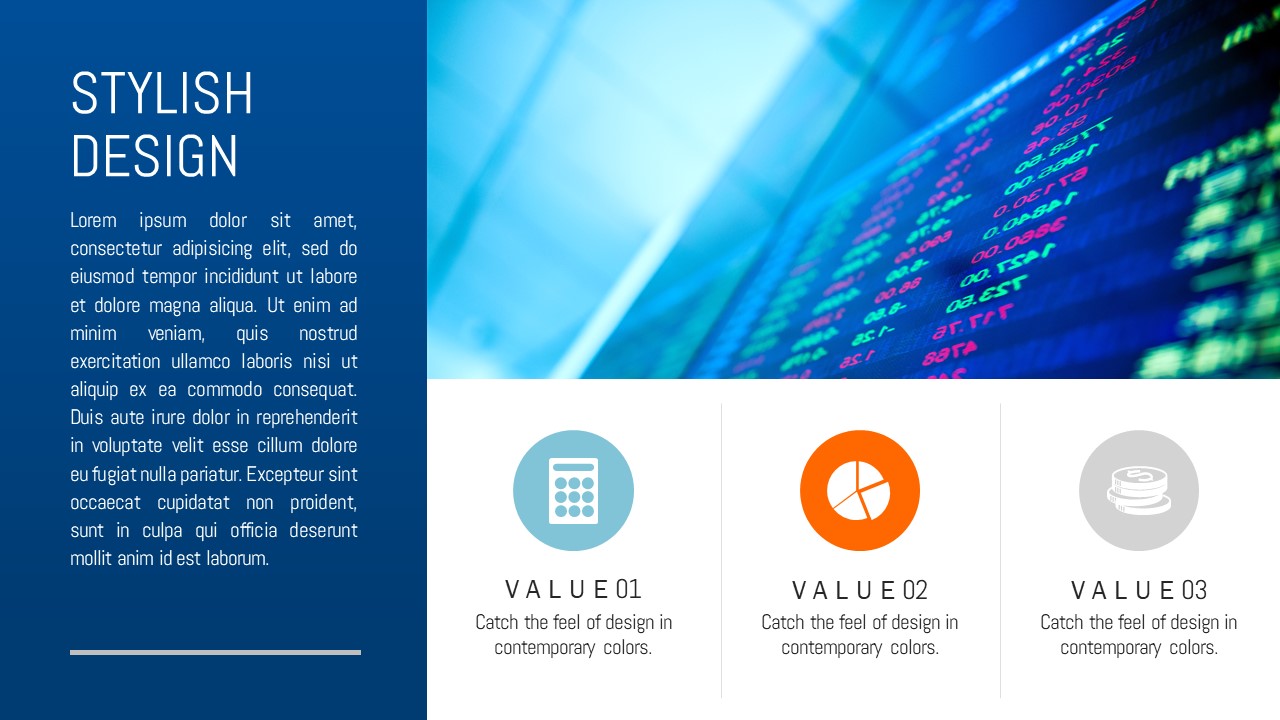
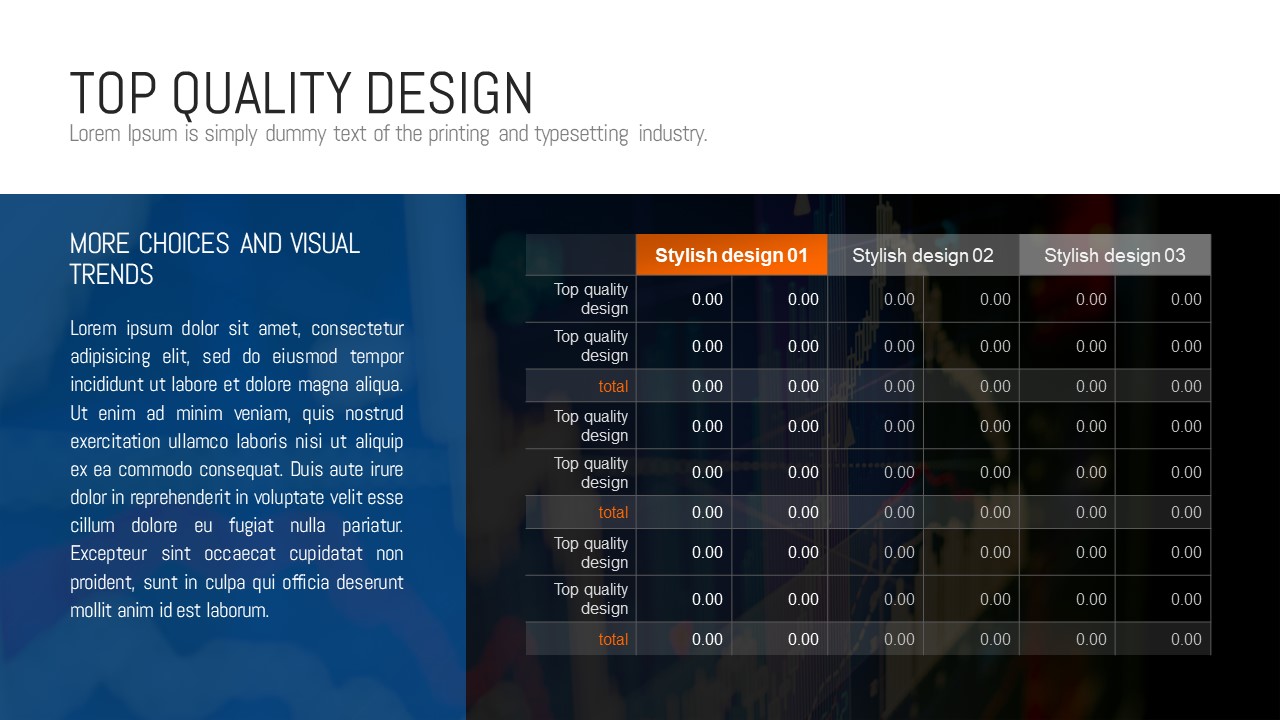
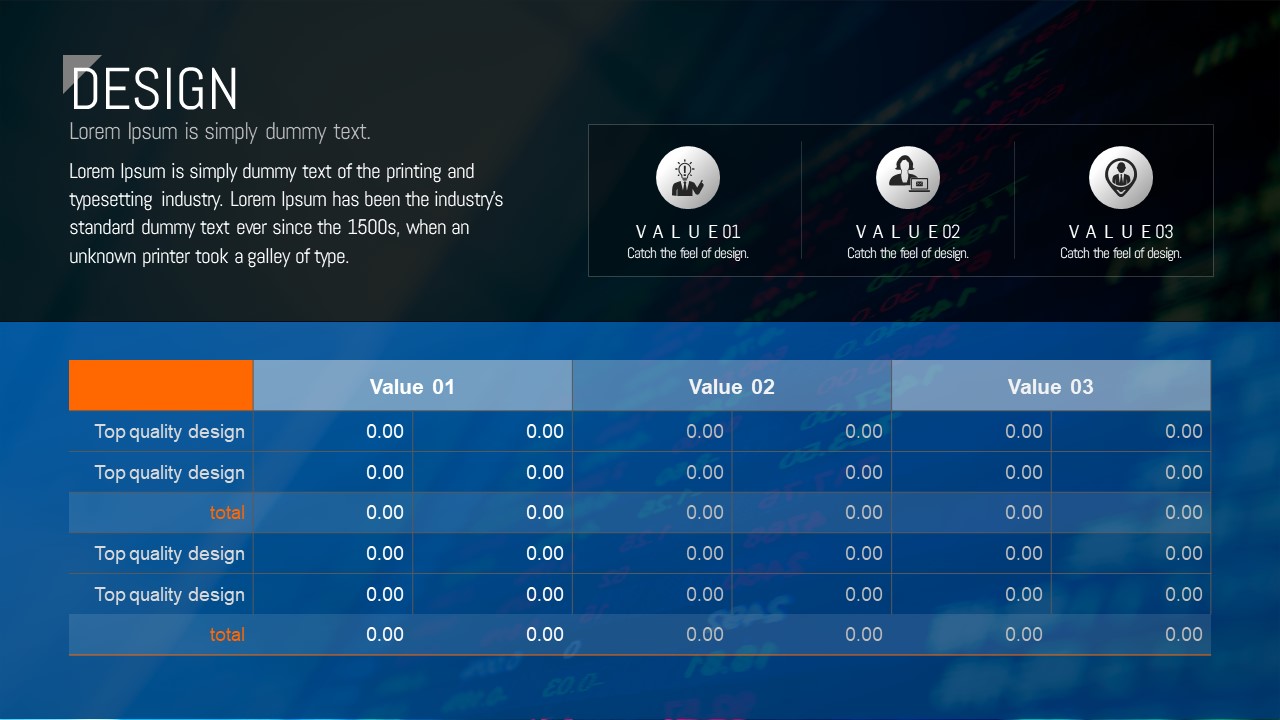
This 30-slide PowerPoint template is purpose-built for stock market, finance, and fintech presentations. The design features a geometric diagonal-split layout combining a deep navy and white base with orange accent colors, while the cover slide incorporates a blue-purple gradient stock chart image that immediately communicates financial expertise. Inside, you'll find a circular three-value icon diagram, a donut chart slide, a two-column text-and-image layout, a smartphone mockup slide, and a multi-row data comparison table — giving you a versatile toolkit for investment reports, market analysis decks, and financial service pitches. All slides are fully editable in PPTX format, allowing you to replace text, swap chart data, and adjust colors to match your brand in minutes. Whether you're preparing a quarterly earnings presentation, an investor pitch, or a fintech product launch deck, this template delivers a professional, data-driven look that builds audience confidence.
Usage Points
-
Main Usage
Designed for stock market analysis, investment reports, financial service introductions, and fintech product pitches where data clarity and professional visual impact are essential to winning audience trust.
-
How to Use
Open the PPTX file, replace placeholder text and chart data with your actual figures, adjust the navy and orange color scheme to your brand palette, and insert your company logo — your presentation is ready to deliver.
-
Recommended For
Best suited for financial analysts, IR managers, investment firm professionals, fintech startup founders preparing investor pitches, and business consultants who need to present complex financial data in a clear, compelling format.
-
Slide Structure
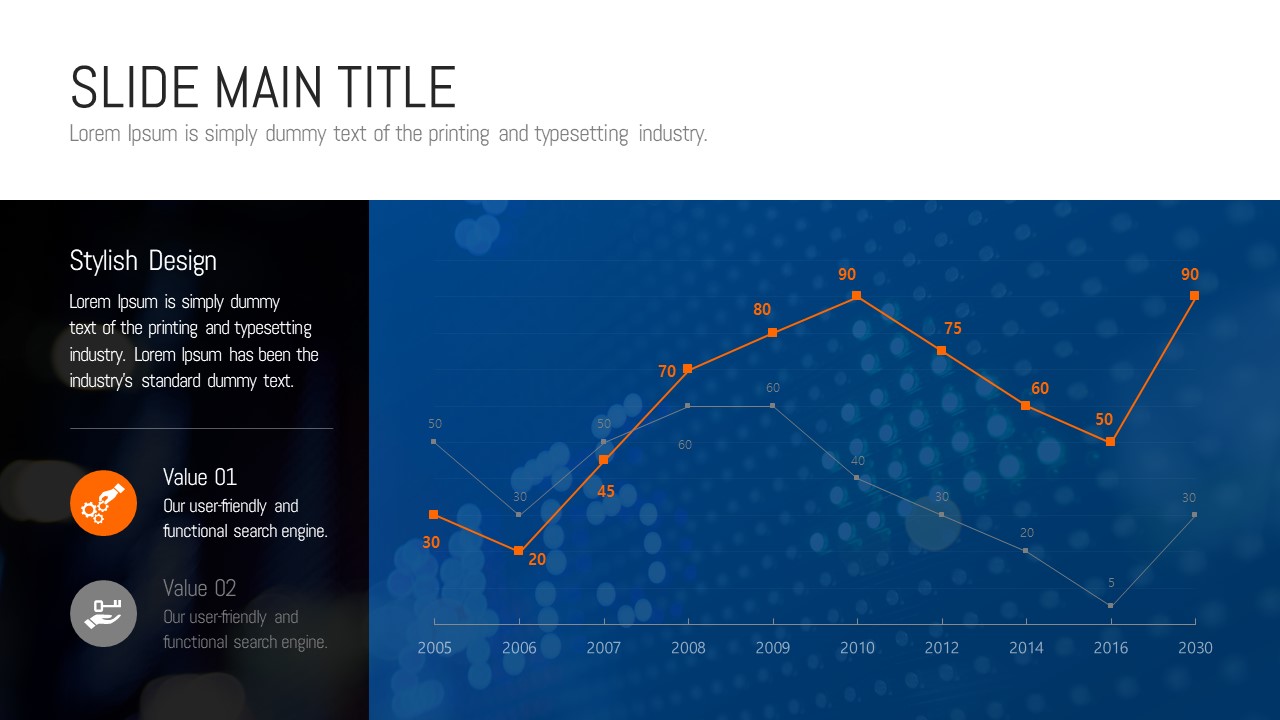
Includes 30 slides: a diagonal-split cover with stock chart background, a 3-value circular icon diagram, a two-column text-and-image layout, a donut chart with icons, a smartphone mockup with 2-value comparison, and a multi-column data comparison table, among others.
Related Products
-

Fountain Pen Theme Presentation – Elegant Business Slide Design
#Business
-

Idea Wide Presentation Template – Modern and Visual Design
#Business
-

Partnership PowerPoint Template – Ideal for Business Presentations
#Business
-

Business Partnership PowerPoint Template – Build Trust with Elegant Design
#Business
