Comparative Analysis Line Graph – Highlighting Competitive Advantage
RJ0300083_8
- Last Update 05/12/2025
- File Size 2.6MB
- # of Slides 2
- File Format PPTX
- Slide Ratio 16:9
- Color
Keywords
About the Product
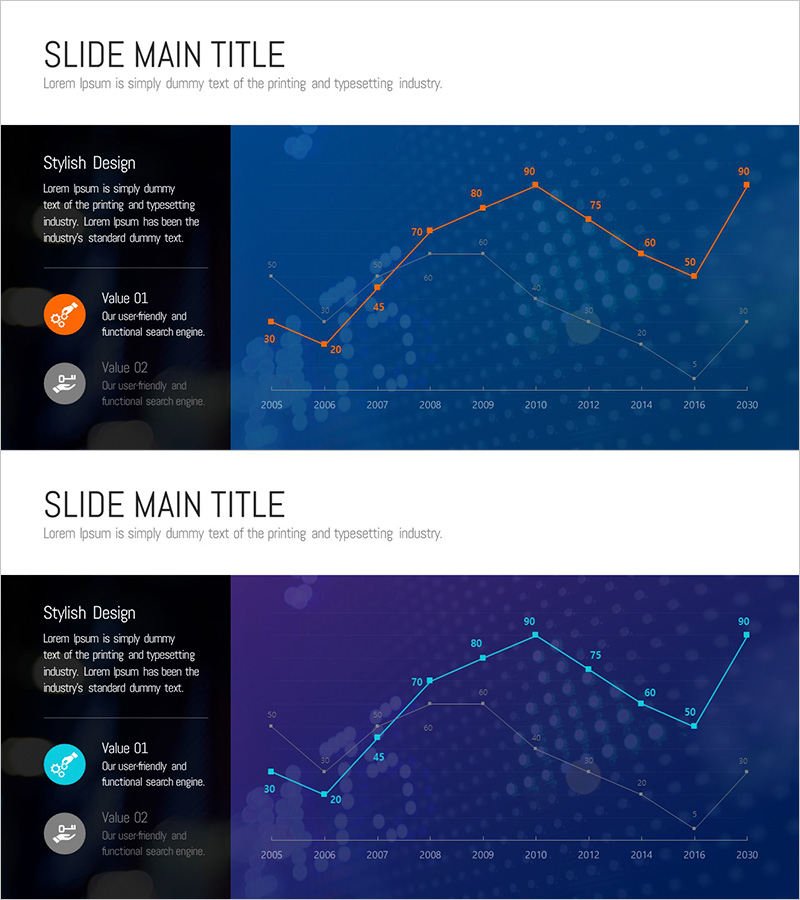
A 2-slide line chart PowerPoint template optimized for competitive analysis and market performance comparison. Features dual-line visualization with orange and cyan series against a deep blue background, tracking data trends from 2005 to 2030. Each slide combines a left black panel with title, description, and two key value indicators, paired with a large right-side graph area for clear numerical data and trend representation. Designed in 16:9 widescreen format for modern presentation environments, fully editable in PPTX format for immediate deployment across business reporting scenarios.
Usage Points
-
Main Usage
Visualizes competitive performance against company metrics or displays market change trends across multiple data series over time. Supports data-driven decision-making in investor presentations, executive briefings, and strategic marketing planning sessions.
-
How to Use
Edit the left black panel title, description, and value items with your analysis content. Modify the right-side graph data points, line colors, and legend to match actual figures. Update year labels, item names, and numerical values to adapt the template to various comparative analysis scenarios.
-
Recommended For
Ideal for executives, business development teams, marketing managers, financial analysts, and consultants presenting competitive analysis, market trends, and performance comparisons. Effective for quarterly and annual performance reports, industry benchmarking, and strategic planning meetings.
-
Slide Structure
2-slide deck in 16:9 ratio. Each slide divides into left black panel (title, description, 2 value icons) and right blue graph area. Graph displays 2-series line chart (orange and cyan lines), X-axis years (2005–2030), Y-axis values (0–90), approximately 15 data points. Semi-transparent circular pattern background adds visual depth.
Related Products
-

Visualizing Menu Sales Status with Line Chart
#Market and Competitor Analysis #Graph #Competitor Analysis
-

Neon Tone Competitor Analysis Broken Line Graph
#Market and Competitor Analysis #Graph #Competitor Analysis
-

Blue Green Broken Line Graph – Competitor Analysis
#Market and Competitor Analysis #Graph #Competitor Analysis
-

Default Line Graph for Market & Competitor Analysis – Competitive Advantage
#Market and Competitor Analysis #Graph #Competitor Analysis
