Business Income Statement – Visualizing Financial Performance
RJ0300083_22
- Last Update 05/12/2025
- File Size 2.8MB
- # of Slides 2
- File Format PPTX
- Slide Ratio 16:9
- Color
Keywords
- #Content-Based Slides
- #Design-Based Slides
- #Financial Plans and Performance
- #Diagram
- #Income Statement
- #Sales and Revenue
- #Table
- #Standard Table
- #16:9
- #income statement PowerPoint
- #financial table slide
- #profit and loss statement template
- #financial performance visualization
- #business table PPT
- #financial analysis presentation
About the Product
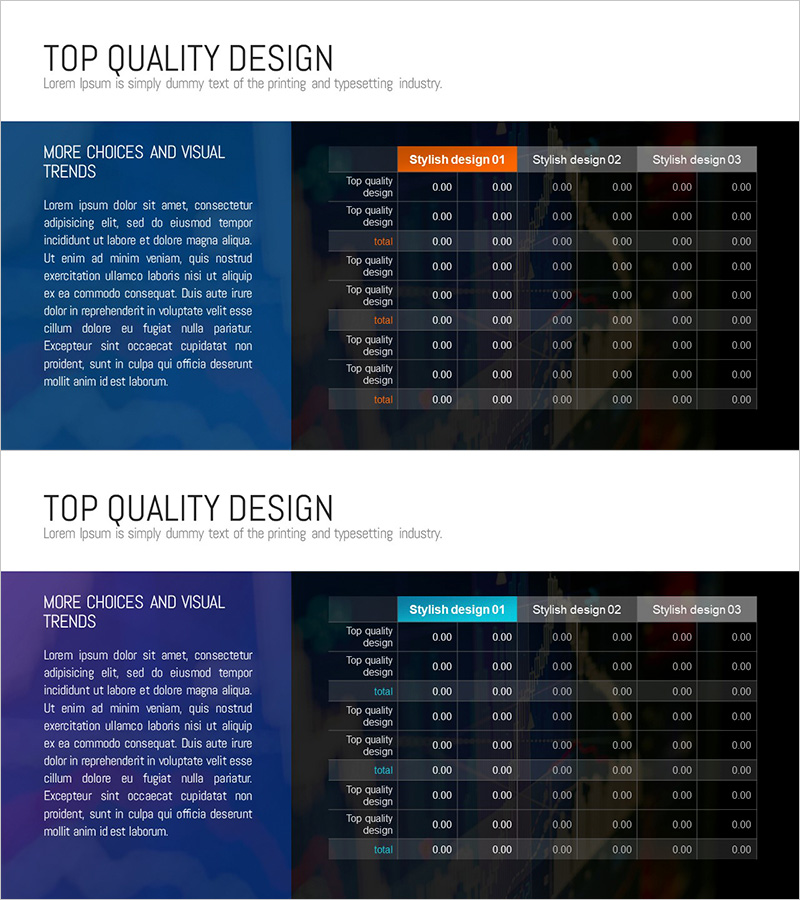
A professional income statement table PowerPoint slide that visualizes financial performance with clarity and precision. Featuring a dark blue background with orange accent headers across 2 slides, the layout combines a left-side text area with a right-side data table for balanced information delivery. The table structure organizes revenue, expenses, and profit metrics in rows, enabling quick comparison across periods or business units. Multiple design options (Stylish design 01, 02, 03) provide flexibility for different presentation contexts. Ready to use for investor presentations, financial reports, quarterly earnings calls, and business performance reviews.
Usage Points
-
Main Usage
Present corporate financial data in a structured table format to communicate earnings performance effectively. The row-based table layout organizes key financial metrics—revenue, cost of goods sold, operating expenses, operating income, and net income—enabling period-to-period or segment-to-segment analysis. Builds credibility with investors, executives, and stakeholders by presenting financial health transparently.
-
How to Use
Deploy in investor relations presentations, quarterly earnings reports, financial analysis briefings, business planning sessions, and annual shareholder meetings. Populate the left text area with strategic commentary or insights, then input actual financial figures into the right-side table for immediate presentation use. Select from three design options to match corporate branding and presentation tone.
-
Recommended For
CFOs, financial controllers, corporate executives, investor relations managers, consultants, and accountants presenting financial results. Ideal for startup pitch decks, public company earnings announcements, management consulting reports, financial institution credit assessments, and board-level financial reviews.
-
Slide Structure
Two-slide layout with each slide divided into left text area (approximately 40%) and right data table area (approximately 60%). The table uses a row-based structure listing income statement line items (revenue, cost of goods sold, gross profit, operating expenses, operating income, pre-tax income, net income). Includes 3+ columns for period-to-period or comparative analysis. Orange header row and gray data cells create visual hierarchy and readability.
Related Products
-

Sales and Profit Table – Visualizing Financial Performance
#Financial Plans and Performance #Diagram #Other
-

Profit Analysis Graph – Visualizing Financial Performance
#Financial Plans and Performance #Diagram #Income Statement
-

Sleek Infographic: Modern Colors and Chart Slide Design
#Financial Plans and Performance #Diagram #Income Statement
-

Illustration Theme Income Statement Table – A Fresh Perspective on Financial Data
#Financial Plans and Performance #Diagram #Income Statement
