Idea Development Status Donut Graph – Effective Market Analysis
RJ0300083_12
- Last Update 05/12/2025
- File Size 2.7MB
- # of Slides 2
- File Format PPTX
- Slide Ratio 16:9
- Color
Keywords
- #Content-Based Slides
- #Design-Based Slides
- #Product/Service Introduction
- #Market and Competitor Analysis
- #Graph
- #Development Status
- #Market Analysis
- #Circles
- #Doughnut Chart
- #16:9
- #donut chart PowerPoint
- #pie chart slide template
- #3-segment data visualization
- #idea development status slide
- #ratio chart PPT download
About the Product
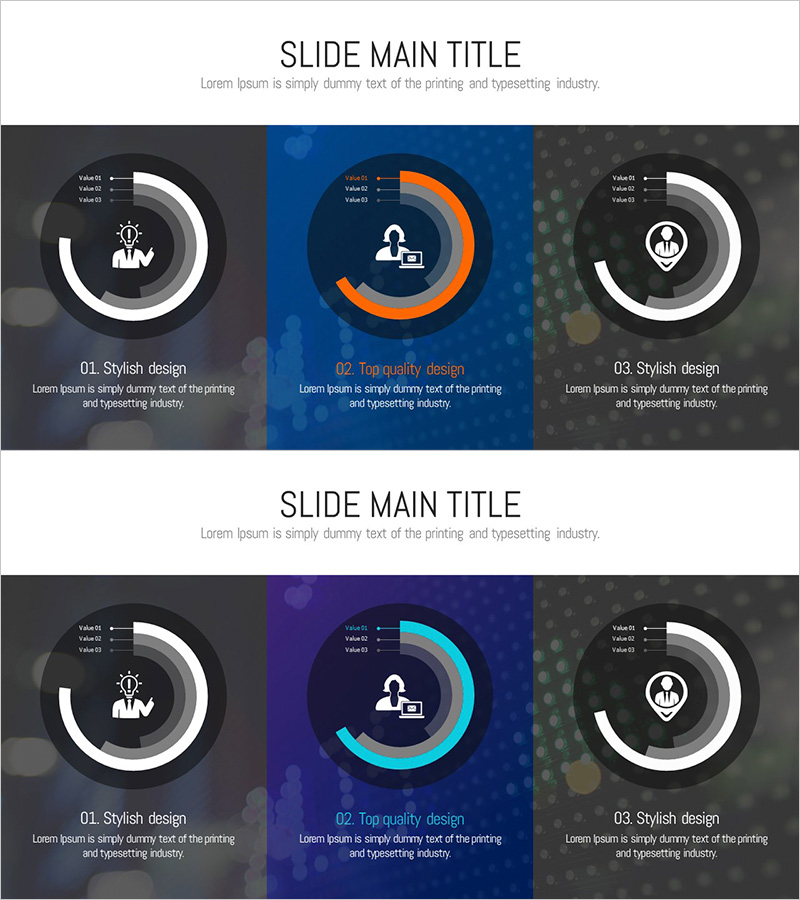
A three-segment donut chart PowerPoint slide designed to visualize idea development status and market analysis data. This presentation template features a dark background with white circular borders and color-coded segments in orange, blue, and gray, each with icons and text labels for intuitive data representation. The slides are ready to use for business proposals, project progress reports, product introductions, and strategic presentations where proportional data visualization is essential.
Usage Points
-
Main Usage
Communicate project progress, market share distribution, product category composition, or development stage breakdown to stakeholders through a clear, proportional donut chart visualization that emphasizes three key data segments.
-
How to Use
Insert into product introduction slides, business status reports, or marketing analysis presentations where data proportions need visual emphasis. Edit segment labels, percentages, and icons to match your actual data without changing the overall design structure.
-
Recommended For
Business planners, marketing professionals, and executives preparing proposals, quarterly reports, or strategic presentations. Ideal for market analysis, customer segmentation, product portfolio overview, and development milestone tracking.
-
Slide Structure
2-slide set with identical donut chart layouts. Each slide contains one 3-segment donut chart with a central icon area and outer segments for labels and numerical data entry. 16:9 widescreen format compatible with modern presentation software.
Related Products
-

Doughnut Chart Slide for 3D Printing Machine Technology Status
#Product/Service Introduction #Market and Competitor Analysis #Graph
-

Development Analysis Donut Graph – Visual Data Presentation
#Product/Service Introduction #Market and Competitor Analysis #Graph
-

Market Environment Analysis Chart – A Visual Indicator for Data Analysis
#Product/Service Introduction #Market and Competitor Analysis #Diagram
-

Businessman Cartoon Theme Circle Graph – Market Analysis and Competitiveness
#Product/Service Introduction #Market and Competitor Analysis #Graph
