Securities Business Analysis Circle Graph
RJ0300083_27
- Last Update 05/12/2025
- File Size 2.6MB
- # of Slides 2
- File Format PPTX
- Slide Ratio 16:9
- Color
Keywords
- #Content-Based Slides
- #Design-Based Slides
- #Product/Service Introduction
- #Market and Competitor Analysis
- #Graph
- #Development Status
- #Market Share
- #Circles
- #Pie Chart
- #16:9
- #pie chart PowerPoint slide
- #donut chart template
- #3-segment data visualization
- #securities analysis slide
- #market share chart
- #financial data presentation
About the Product
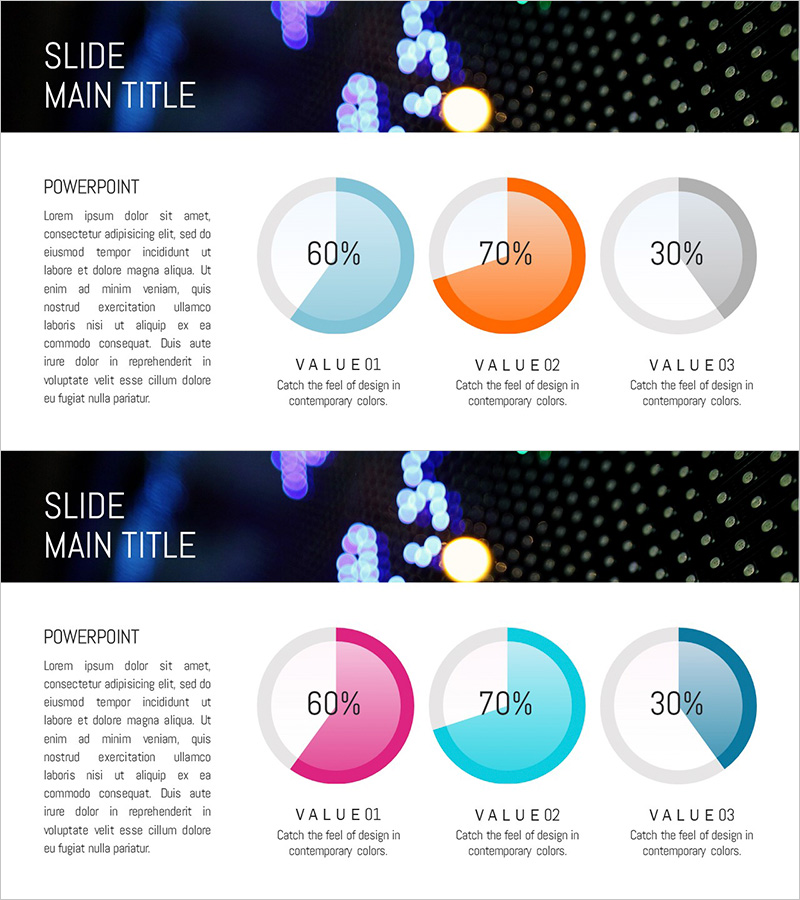
A donut-style pie chart PowerPoint slide optimized for securities and financial business analysis. This presentation template visualizes the proportion of three data segments—ideal for market share, revenue composition, and portfolio allocation in financial reports. The design features contrasting color schemes: blue, orange, and gray in the first version; pink, cyan, and dark blue in the second. Each segment displays its percentage value (60%, 70%, 30%) with descriptive labels below. The two-slide set offers flexible color options to match your presentation theme. Delivered in 16:9 widescreen PPTX format, fully editable and ready to customize with your own data.
Usage Points
-
Main Usage
Visualize three-part financial data—market share, revenue breakdown, or portfolio composition—in a clear, professional pie chart format that communicates proportions instantly to investors and stakeholders.
-
How to Use
Replace the sample percentages (60%, 70%, 30%) and value labels (VALUE01–03) with your actual financial data. Choose between the blue-orange-gray or pink-cyan-dark blue color scheme based on your presentation's overall design theme.
-
Recommended For
Investment presentations, quarterly earnings reports, portfolio analysis documents, and market research reports for securities firms, asset management companies, and financial institutions. Ideal for analysts, fund managers, and business development professionals.
-
Slide Structure
Two-slide set with identical layouts but different color palettes. Each slide features a dark header banner with title area, three donut-style pie charts in the center (displaying 60%, 70%, and 30% respectively), and descriptive legend text below each chart.
Related Products
-

Modern Theme Pie Chart – Market Share Analysis
#Product/Service Introduction #Market and Competitor Analysis #Graph
-

Development Status Pie Chart – Visualizing Product Progress
#Product/Service Introduction #Market and Competitor Analysis #Graph
-

Development Status Pie Chart – Efficient Data Delivery
#Product/Service Introduction #Market and Competitor Analysis #Graph
-

Pie Chart of the Development Status of the Snow Mountain Theme
#Product/Service Introduction #Market and Competitor Analysis #Diagram
