Clustered Vertical Bar Graph Slide – Visualizing Market Analysis
RJ0300083_5
- Last Update 05/12/2025
- File Size 2.8MB
- # of Slides 2
- File Format PPTX
- Slide Ratio 16:9
- Color
Keywords
- #Content-Based Slides
- #Design-Based Slides
- #Market and Competitor Analysis
- #Diagram
- #Graph
- #Competitor Analysis
- #Market Analysis
- #Cluster
- #Column
- #Closed Cluster Diagram
- #Grouped Column
- #16:9
- #clustered bar chart PowerPoint
- #vertical bar graph slide
- #data comparison template
- #market analysis chart
- #competitive analysis slide
About the Product
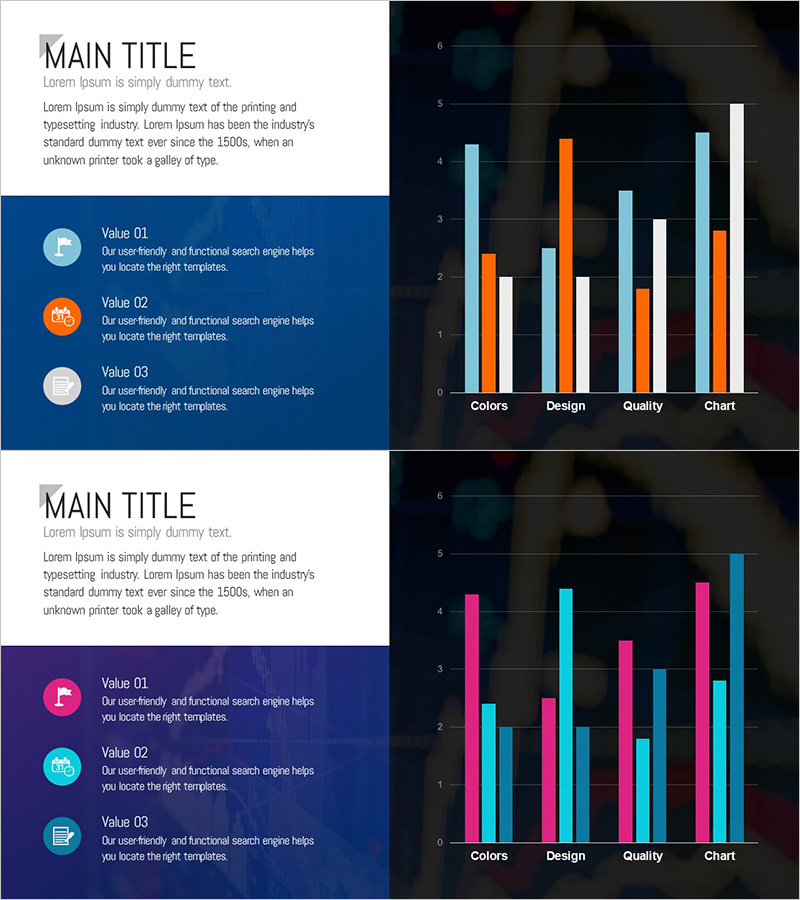
A professional clustered vertical bar chart PowerPoint slide designed for market analysis and competitive benchmarking presentations. This template visualizes 4 data series (orange, black, light blue, and white) across 4 categories—Colors, Design, Quality, and Chart—enabling clear side-by-side comparison of multiple metrics. The 2-slide deck features a grid background for precise value reading and is fully editable, allowing you to input your own data labels and numerical values. Ideal for business reports, market research presentations, and performance analysis slides.
Usage Points
-
Main Usage
Compare multiple data series across several categories in a single, easy-to-read visualization. Perfect for presenting market analysis, competitor benchmarking, product performance metrics, customer satisfaction surveys, and any multi-dimensional business data that requires side-by-side comparison.
-
How to Use
Edit the bar heights to reflect your actual data values. Customize the legend labels and colors to match your analysis categories. The grid lines aid in accurate value interpretation. Simply replace the category names (Colors, Design, Quality, Chart) and data series labels with your own metrics.
-
Recommended For
Marketing professionals, executives, management consultants, data analysts, and business intelligence teams. Suitable for quarterly performance reports, market research presentations, competitive positioning analysis, product improvement roadmaps, and strategic planning sessions.
-
Slide Structure
2-slide template featuring a clustered vertical bar chart with 4 data series (orange, black, light blue, white) across 4 categories on the X-axis and a 0–6 scale on the Y-axis. Each category displays 4 bars side-by-side for direct series comparison, with a dark background and grid lines for enhanced readability.
Related Products
-

Competitor Comparison Analysis Bar Graph – Data Visualization for Market Analysis
#Market and Competitor Analysis #Diagram #Graph
-

Experimental Results Analysis Vertical Bar Graph – Incorporating Visual Trends
#Market and Competitor Analysis #Diagram #Graph
-

VR Market Analysis Bar Graph
#Market and Competitor Analysis #Diagram #Graph
-

Business Area Analysis Graph – Suitable for Market and Competitive Analysis
#Market and Competitor Analysis #Diagram #Graph
