Securities Service Analysis Graph – Competitor Analysis
RJ0300083_20
- Last Update 05/12/2025
- File Size 2.8MB
- # of Slides 2
- File Format PPTX
- Slide Ratio 16:9
- Color
Keywords
- #Content-Based Slides
- #Design-Based Slides
- #Market and Competitor Analysis
- #Graph
- #Competitor Analysis
- #Market Analysis
- #Horizontal Bar
- #Horizontal Bar Chart
- #16:9
- #horizontal bar chart PowerPoint
- #competitor analysis presentation
- #financial services slide
- #bar graph template
- #comparative analysis slide download
About the Product
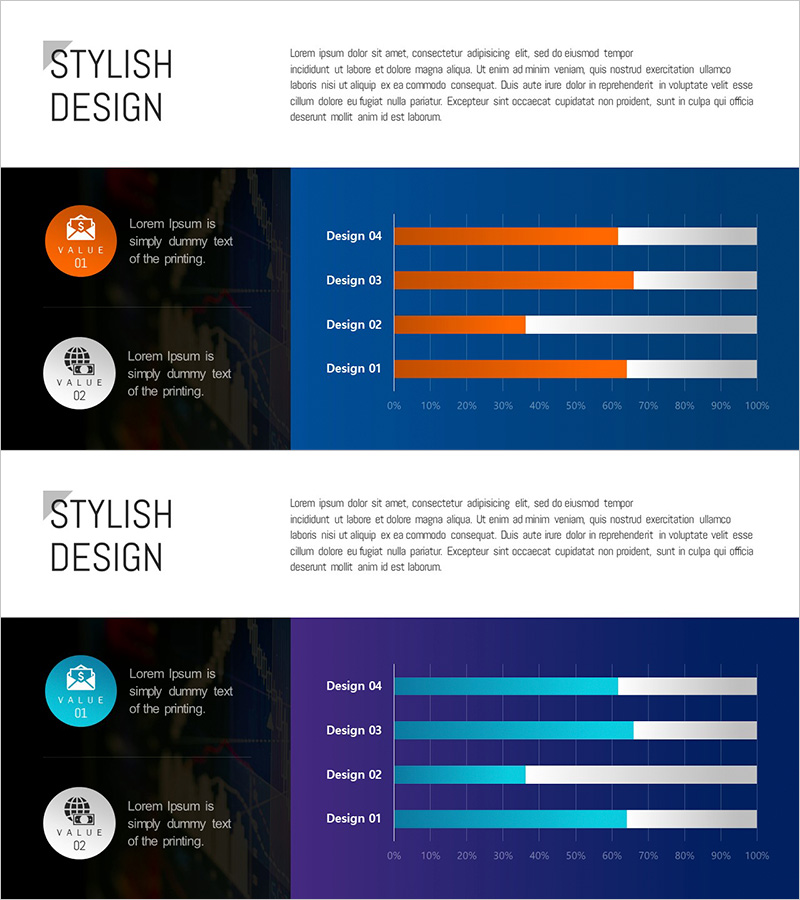
A horizontal bar chart PowerPoint slide optimized for securities and financial product competitor analysis. Set against a dark blue background, orange and white bars visualize the performance of four competitors on a 0–100% scale, representing market share, customer satisfaction, product competitiveness, or revenue. The 2-slide set provides identical layouts with variations for immediate application across multiple analysis topics. Delivered in 16:9 widescreen PPTX format compatible with all PowerPoint versions, with fully editable colors, values, and labels for seamless customization.
Usage Points
-
Main Usage
Clearly visualizes competitive performance comparison in the financial and securities industry. Displays four metrics—market share, customer satisfaction, product competitiveness, and revenue—as horizontal bars, enabling stakeholders to instantly grasp each competitor's relative position.
-
How to Use
Deploy in investor relations (IR) presentations, business reports, marketing strategy briefings, and executive dashboards during the competitive landscape analysis section. Modify bar lengths and values to reflect actual data, and update competitor names and metric labels to match your presentation context.
-
Recommended For
Strategy planning, marketing, and investor relations teams at securities firms, asset management companies, and financial consulting firms preparing competitive analysis materials. Also suitable for financial product development teams explaining competitive positioning during new service launches.
-
Slide Structure
Both slides share identical layout: left side features two orange circular icons (VALUE 01 & 02) with descriptive text; right side displays a dark blue background with horizontal bar chart (Design 01–04, 0–100% scale, orange and white bars). Each bar is independently editable with grid lines for easy value reading and precise data representation.
Related Products
-

Stylish Bar Chart Slide Design
#Market and Competitor Analysis #Diagram #Graph
-

Pencil Bar Chart for Market Analysis – Visual Competitiveness
#Market and Competitor Analysis #Graph #Other
-

Competitor Growth Comparison Chart – Essential Slide for Market Analysis
#Market and Competitor Analysis #Graph #Competitor Analysis
-

Competitive Hotel Service Comparison Analysis Diagram
#Market and Competitor Analysis #Graph #Competitor Analysis
