Bank Securities Service Area Graph – Market Analysis and Competitive Advantage
RJ0300083_24
- Last Update 05/12/2025
- File Size 2.7MB
- # of Slides 2
- File Format PPTX
- Slide Ratio 16:9
- Color
Keywords
About the Product
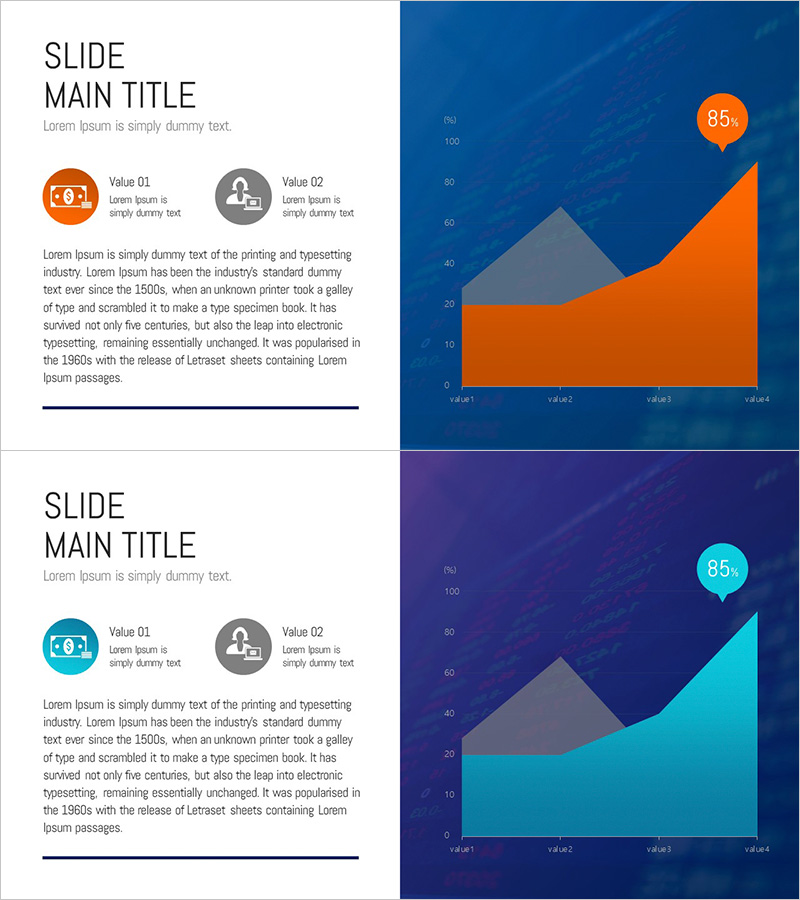
A 2-slide PowerPoint presentation designed to visualize banking, securities, and financial service areas. The dark blue background features an area chart with orange and cyan color separation, effectively illustrating market share, competitive comparison, and service area analysis. The left side contains a title, subtitle, and two key-point icons, while the right side displays a four-point area chart. In 16:9 widescreen PPTX format, fully editable and ready to use. Perfect for financial, IT, and consulting presentations to convey competitive advantage and market positioning with impact.
Usage Points
-
Main Usage
Visualizes market share, competitive positioning, and service area analysis for financial, securities, and banking sectors using an area chart. The dark blue background with orange and cyan color distinction creates strong contrast, enabling audiences to instantly grasp competitive advantage and market landscape.
-
How to Use
Insert into IR materials, business proposals, or market analysis reports in the market overview and competitive analysis sections. Enter your title and key messages in the left text area, then update the chart data values with actual figures. During presentation, emphasize market shifts or service expansion by highlighting color changes across areas.
-
Recommended For
Financial, securities, and banking professionals; consultants; and investor-facing teams. Especially effective when explaining market share evolution, competitor positioning, and service area expansion strategies. Enhances credibility in executive briefings, investment pitches, and strategic planning meetings.
-
Slide Structure
Two-slide set. Each slide features a left text area (title, subtitle, two icon-based points) and a right area chart (four data points, two-color distinction). First slide emphasizes orange; second emphasizes cyan, allowing flexible color variations optimized for comparative analysis.
Related Products
-

Business Program Analysis Area Graph – Competitive Edge
#Market and Competitor Analysis #Diagram #Graph
-

Business Analysis Chart – Visualizing Competitive Advantage
#Market and Competitor Analysis #Graph #Other
-

Zombie Walking Dead Slide – Optimized for Competitor Analysis with Doughnut Chart
#Market and Competitor Analysis #Graph #Other
-

Competitor Analysis Area Graph – Visualizing Market Advantage
#Market and Competitor Analysis #Graph #Other
