Securities Business Overview – Slide with Vision and Strategy
RJ0300083_19
- Last Update 05/12/2025
- File Size 2MB
- # of Slides 2
- File Format PPTX
- Slide Ratio 16:9
- Color
Keywords
About the Product
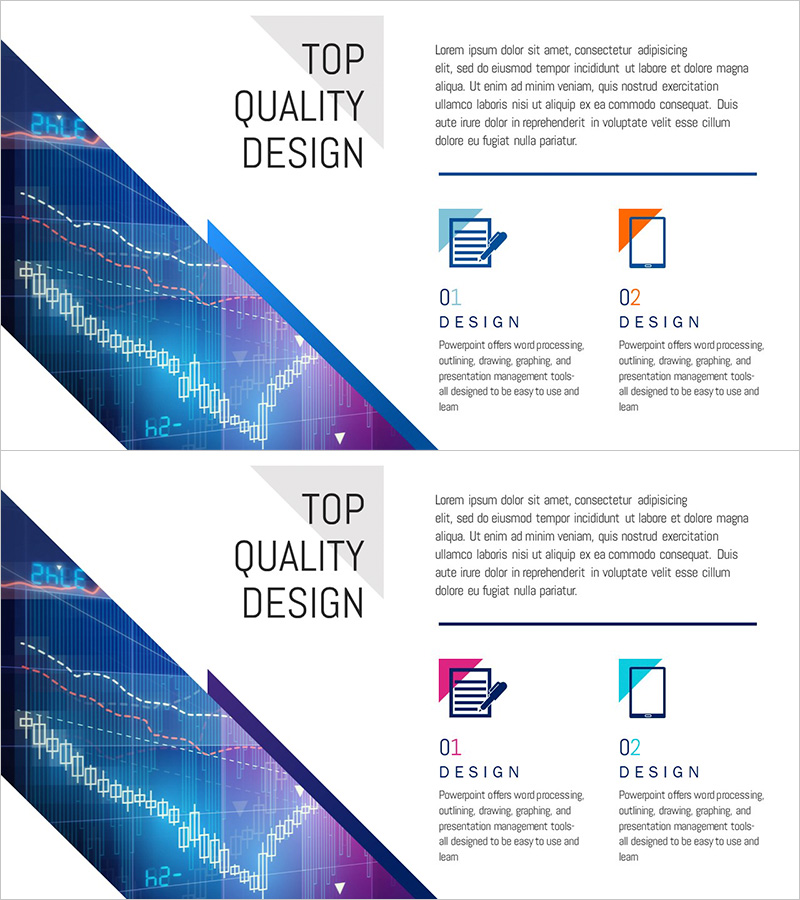
A 2-slide PowerPoint presentation template designed to showcase your securities or financial business overview with vision and strategy. The layout features a diagonal graph area on the left side paired with text and icon elements on the right, creating a comparative visual structure. Dark blue, purple, and orange color accents highlight data-driven insights while maintaining professional clarity. Perfect for company introduction presentations, investor pitches, and strategic planning sessions. Delivered in 16:9 widescreen PPTX format for seamless compatibility across all devices and platforms.
Usage Points
-
Main Usage
Designed for the business overview section of company introduction presentations. The left-right layout allows you to present quantitative performance data on one side and qualitative strategic direction on the other. Ideal for investor presentations, partner meetings, and employee onboarding where clear communication of business scope and future direction is essential.
-
How to Use
Insert your actual revenue, growth rate, or market share data into the left-side graph area on the first slide. Add your core vision and strategy statements in the right-side text boxes. Use the second slide to emphasize additional strategic priorities or business objectives. All icons and colors are fully editable to match your corporate brand guidelines.
-
Recommended For
Optimized for securities, financial services, insurance, and asset management companies. Also suitable for manufacturing, retail, and IT firms presenting business overviews. Recommended for executive reports, investor relations presentations, and new business proposal decks where business status and strategic direction must be communicated together.
-
Slide Structure
Two-slide format with each slide divided into a left diagonal graph area for charts and data visualization, and a right section for text and icons. Text input areas include one title, 2-3 body text blocks, and 2 icon placeholders, creating a clear information hierarchy.
Related Products
-

Company Overview Plus Diagram – Vision and Strategy
#Company Introduction #Business Introduction #Business Vision and Strategy
-

Energy Business Company Overview – Vision and Strategy
#Company Introduction #Business Introduction #Business Vision and Strategy
-

Introduction Effect Detail Analysis Diagram - Core of Business Strategy
#Company Introduction #Business Introduction #Business Vision and Strategy
-

Business Company Introduction Slide – Harmony of Teal and Orange
#Company Introduction #Business Introduction #Business Vision and Strategy
