Introducing the Securities Service Program – Innovation and Goal Achievement
RJ0300083_23
- Last Update 05/12/2025
- File Size 7.1MB
- # of Slides 2
- File Format PPTX
- Slide Ratio 16:9
- Color
Keywords
- #Content-Based Slides
- #Design-Based Slides
- #Product/Service Introduction
- #Business Vision and Strategy
- #Diagram
- #Program Introduction
- #Business Goals
- #Cluster
- #Closed Cluster Diagram
- #16:9
- #closed-form cluster diagram PowerPoint
- #overlapping structure slide
- #financial services PPT template
- #value proposition diagram
- #relationship chart PowerPoint
- #how to create cluster diagram in PowerPoint
About the Product
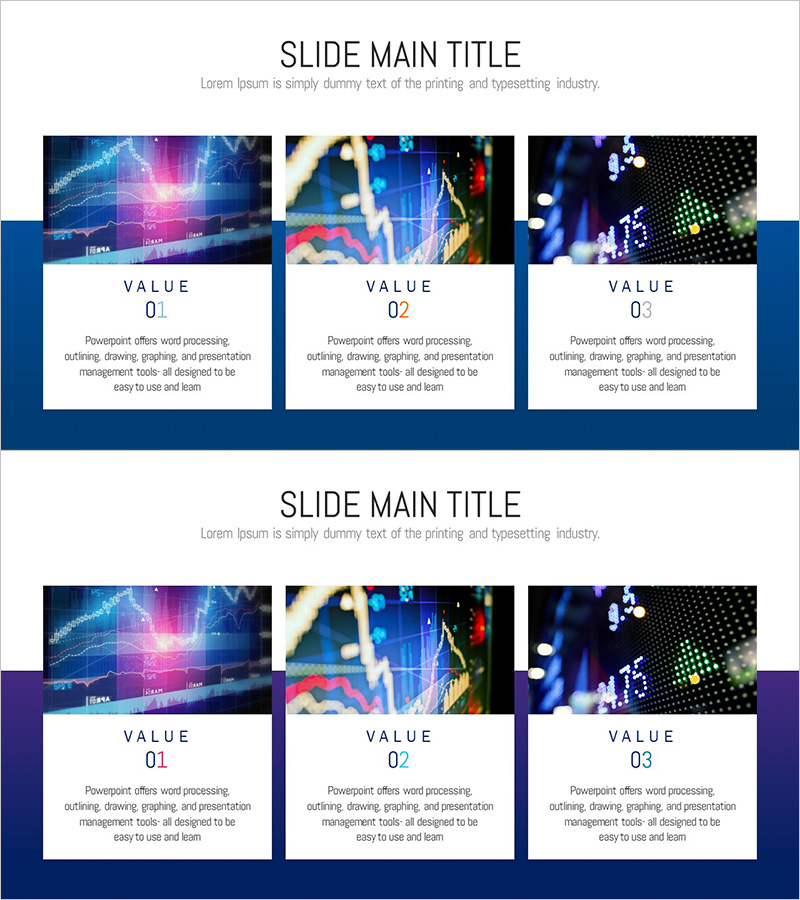
A closed-form cluster diagram PowerPoint slide designed for introducing securities service programs. Three independent areas overlap to visualize mutual relationships and integrated concepts. Dark blue background combined with pink and green gradient image elements conveys innovation in the financial and technology sectors. Each area features a VALUE label and descriptive text box at the bottom, clearly communicating three core values. The 2-slide composition is ready for immediate use in presentation flows.
Usage Points
-
Main Usage
Visualizes three core values of securities and financial service programs through an overlapping cluster structure, emphasizing mutual relationships and integrated concepts. Effectively communicates innovation, goal achievement, and service integration simultaneously.
-
How to Use
Replace the image portions in each area with your own content, and edit the text below the VALUE labels to input three key messages. Use as product introduction, business vision, or strategy presentation slides to enhance audience comprehension.
-
Recommended For
Recommended for financial institutions, securities firms, and fintech companies presenting product introductions, executive reports, and investor pitch materials. Useful for marketing managers, sales teams, and business planning departments conveying service value propositions persuasively.
-
Slide Structure
2-slide composition. Each slide features a 3-area overlapping layout with dark blue side bars (top and bottom). Left, center, and right areas contain image sections (financial, technology, and network visualization) with VALUE text boxes (01, 02, 03) positioned at the bottom.
Related Products
-

Research and Development Goals Diagram – Roadmap for Innovation
#Product/Service Introduction #Business Vision and Strategy #Diagram
-

Introducing the Startup Business Program – Innovation and Growth
#Product/Service Introduction #Business Vision and Strategy #Diagram
-

Introduction to Positive Business Practices – Professionalism and Trust
#Product/Service Introduction #Business Vision and Strategy #Diagram
-

Bank Securities Service Procedures Slide – Product and Service Introduction
#Product/Service Introduction #Business Vision and Strategy #Diagram
