Company Presentation Wide Template – Modern and Stylish Design
J0300064
- Last Update 07/31/2025
- File Size 38.9MB
- # of Slides 31
- File Format PPTX
- Slide Ratio 16:9
- Color
Slide Preview


Keywords
About the Product
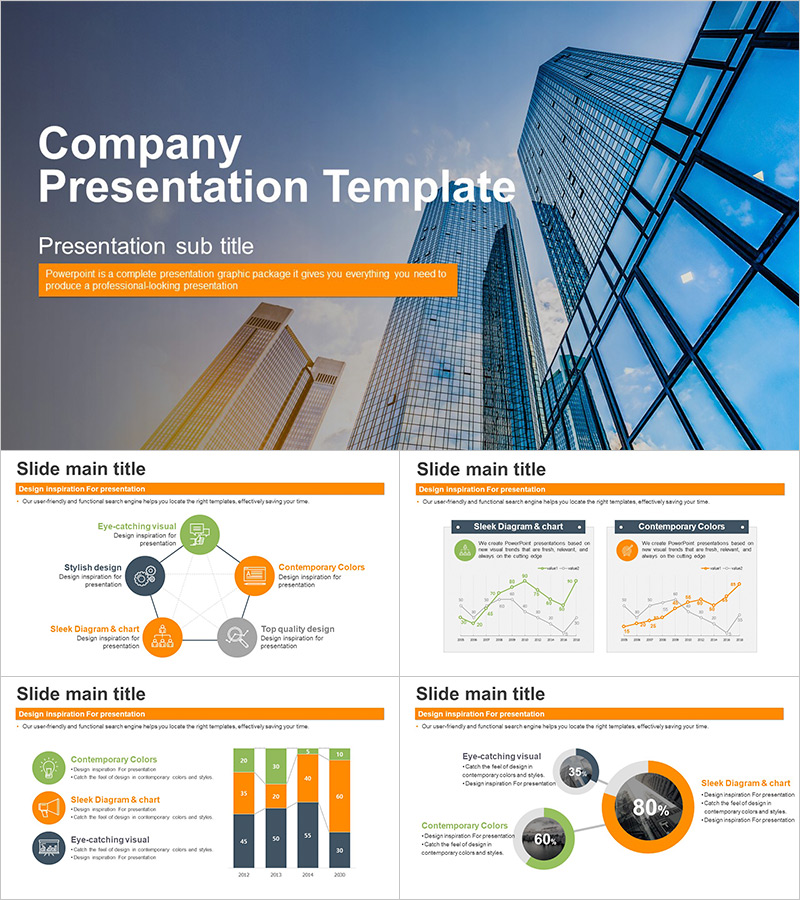
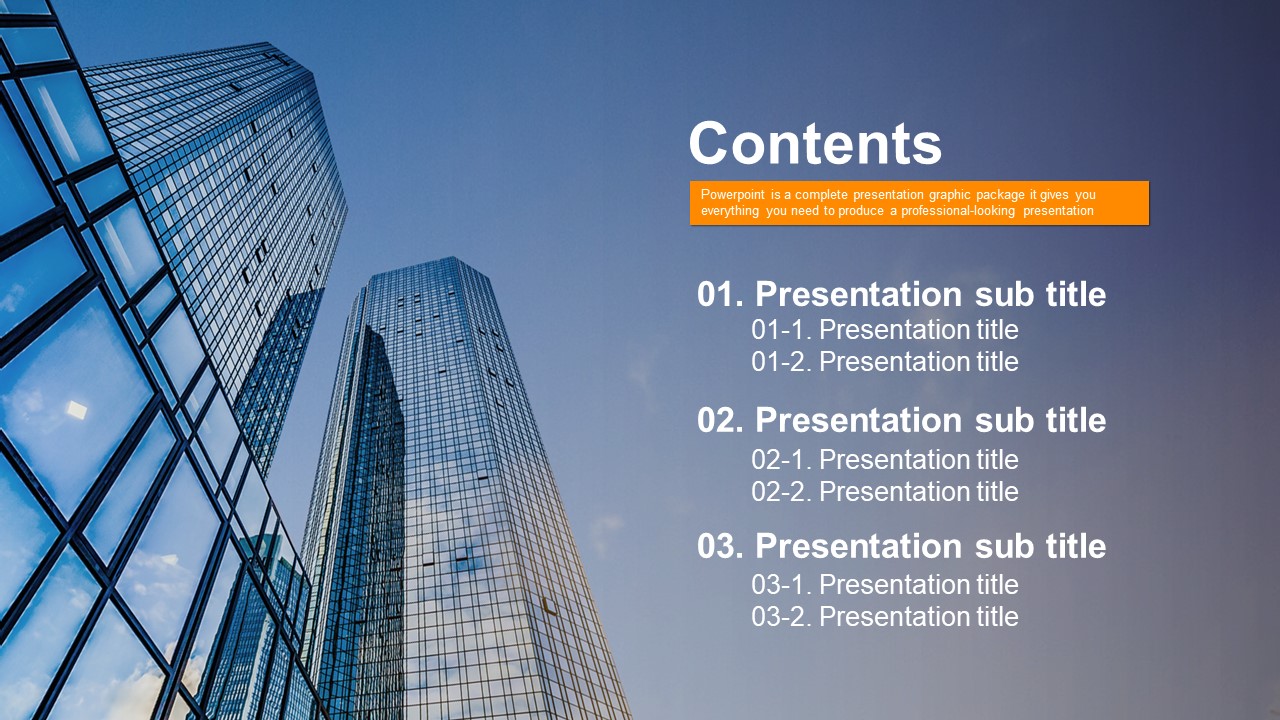
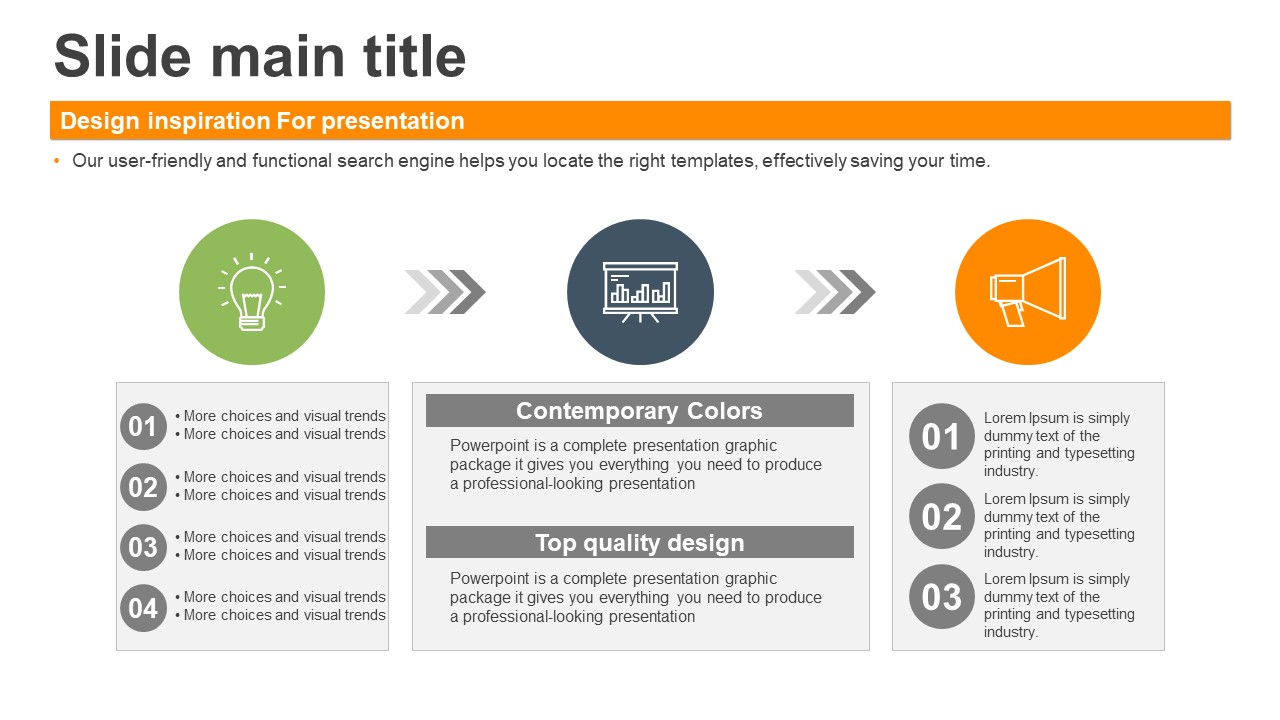
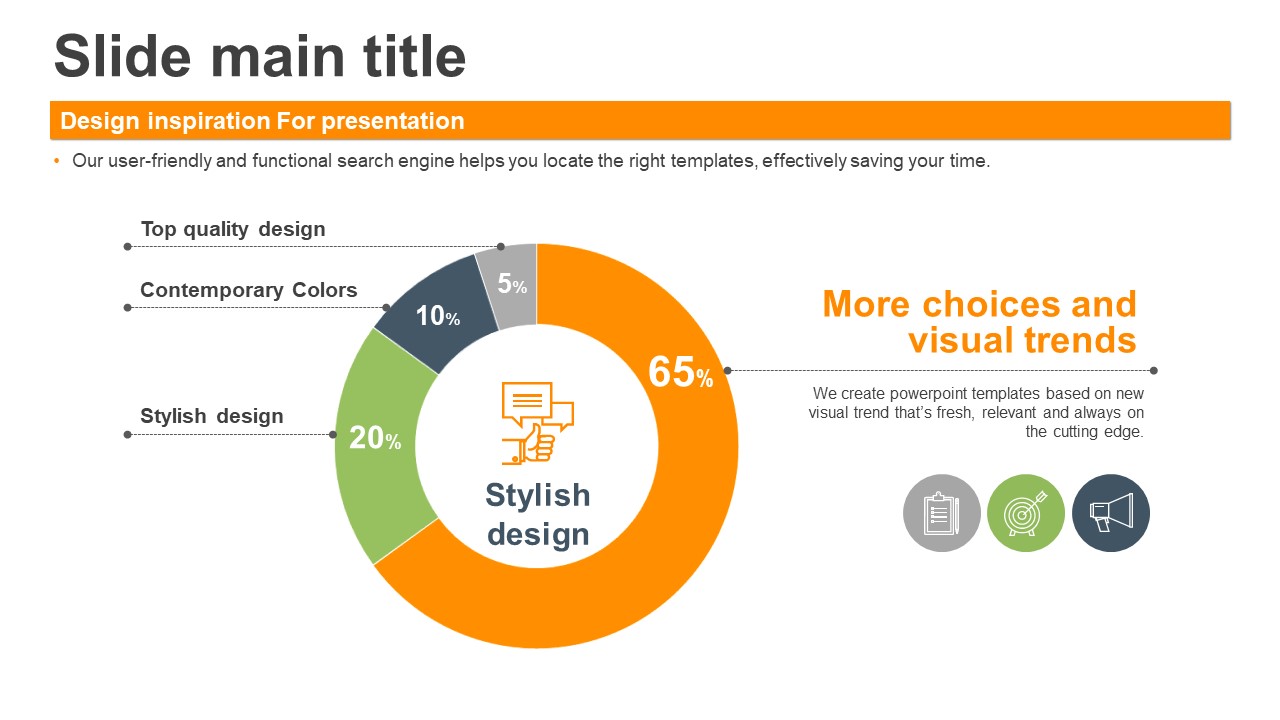
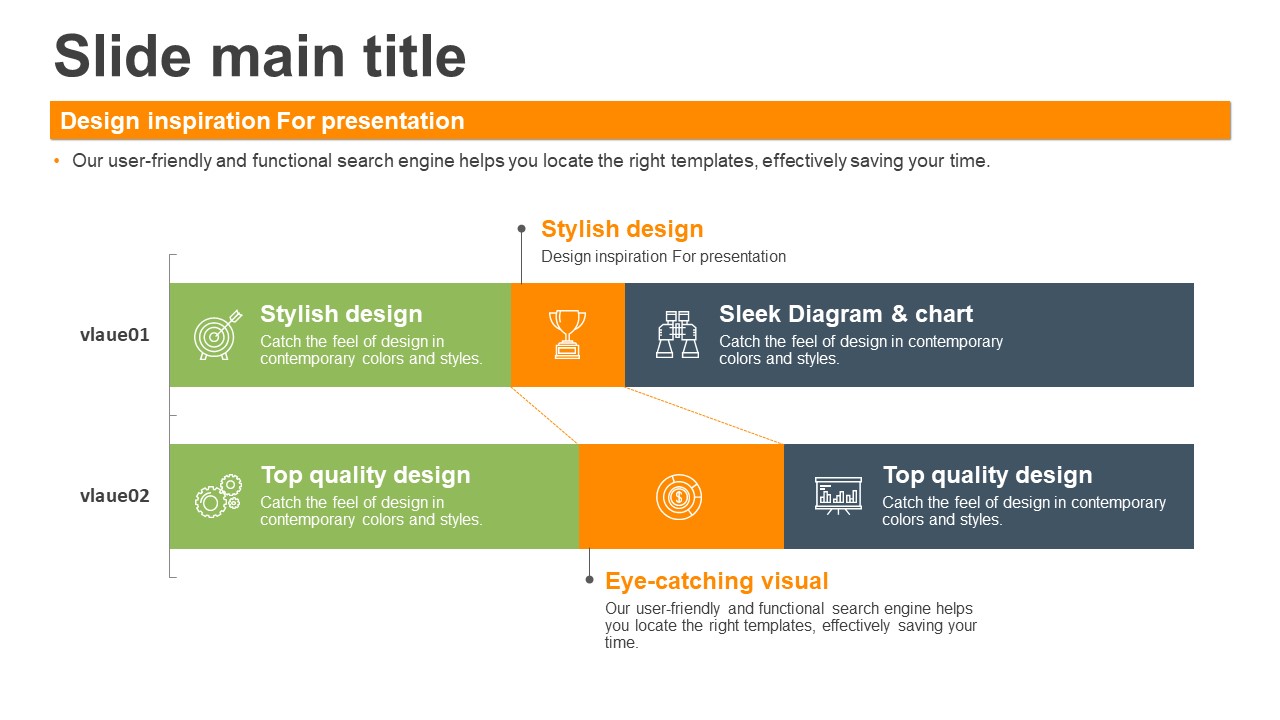
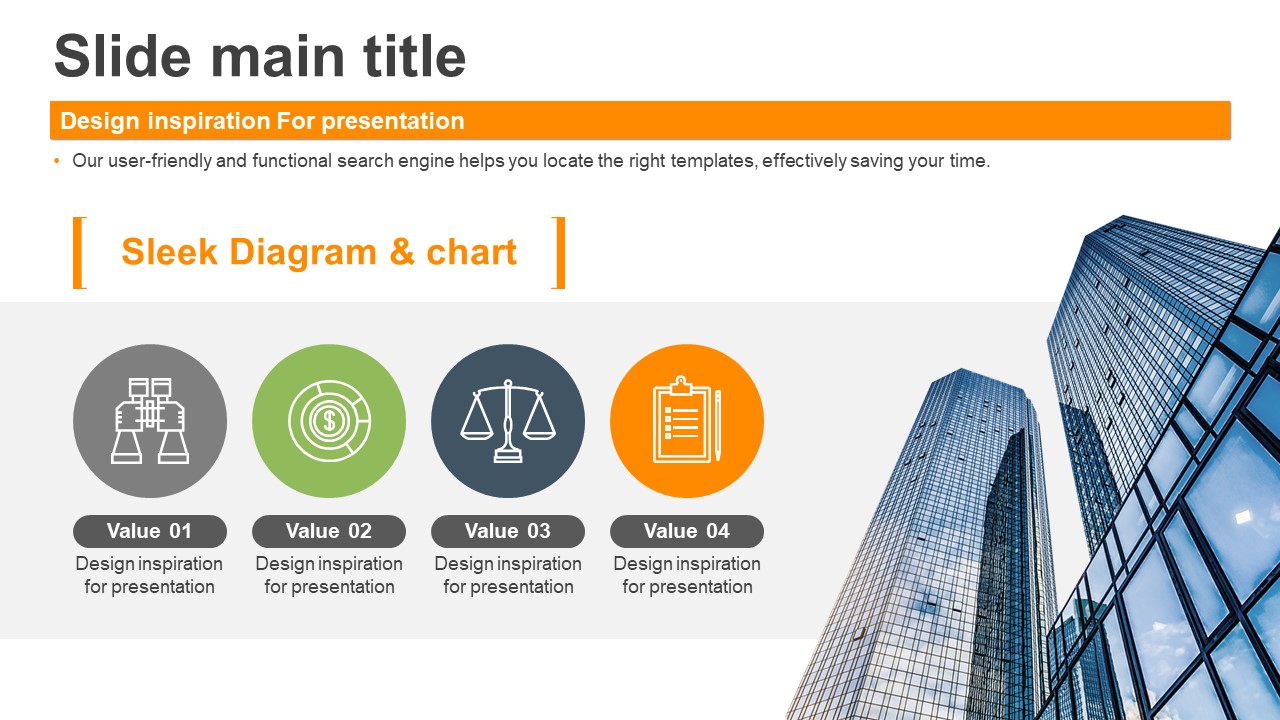
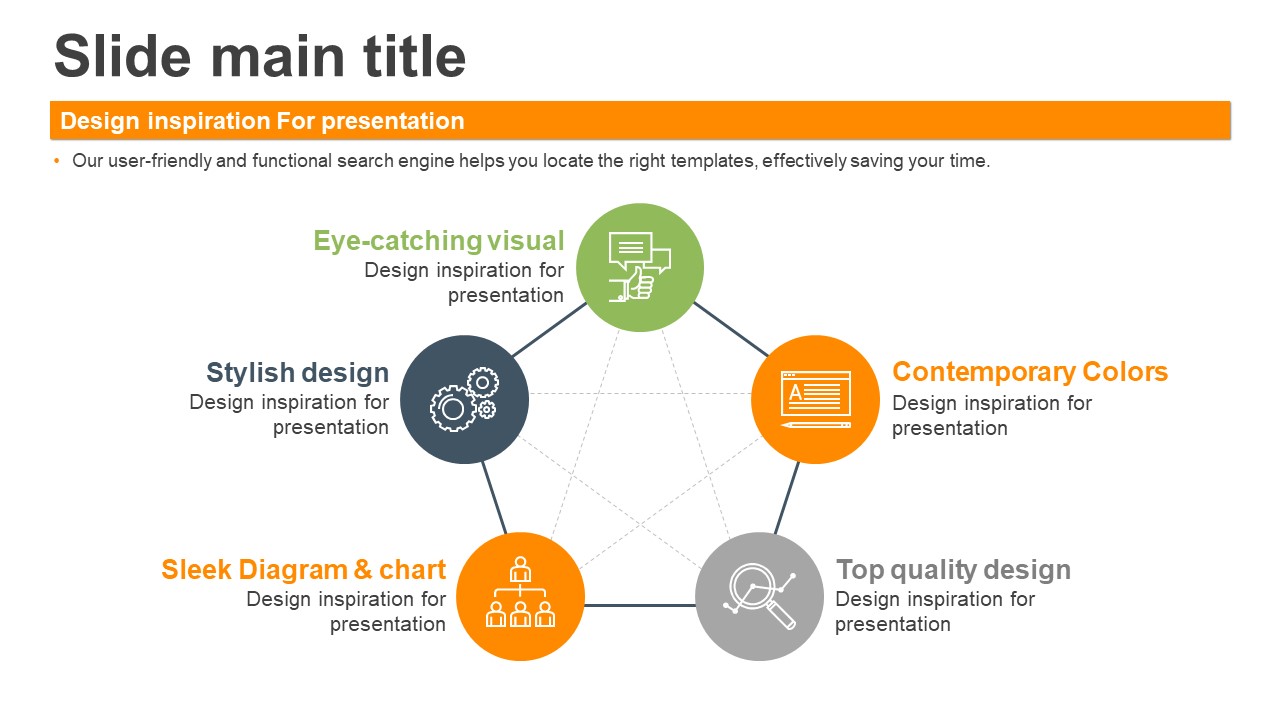
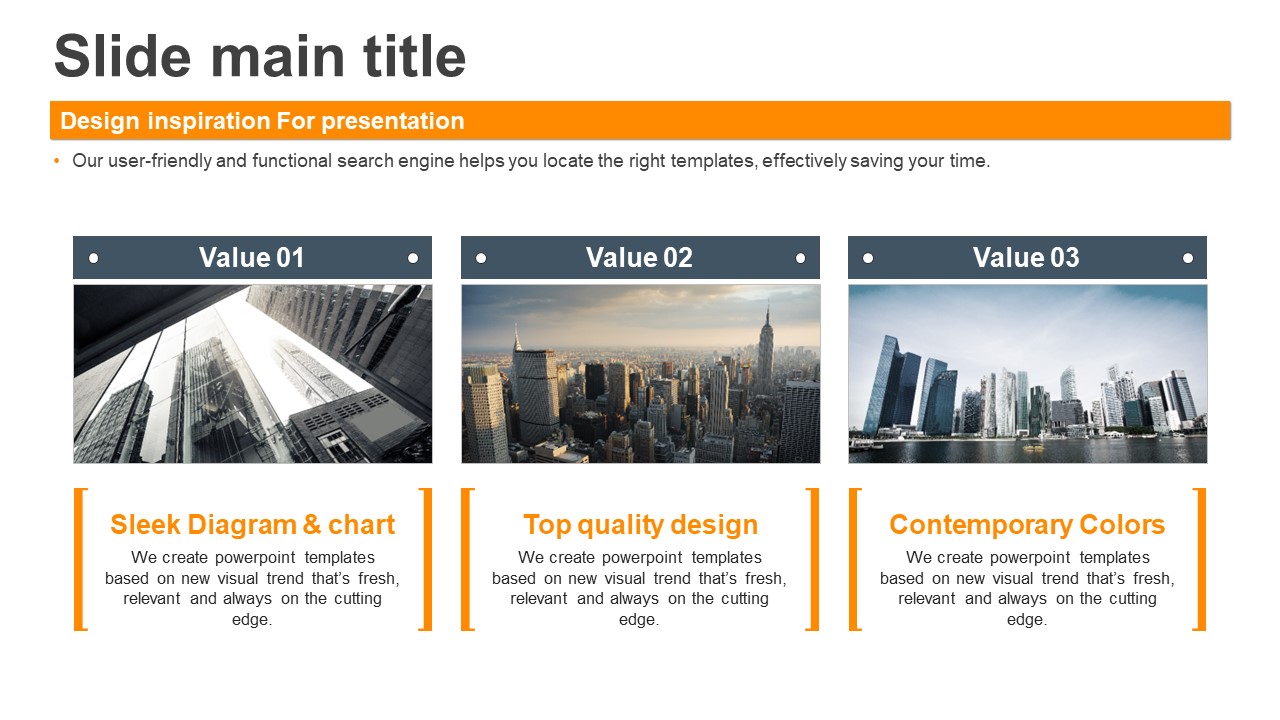
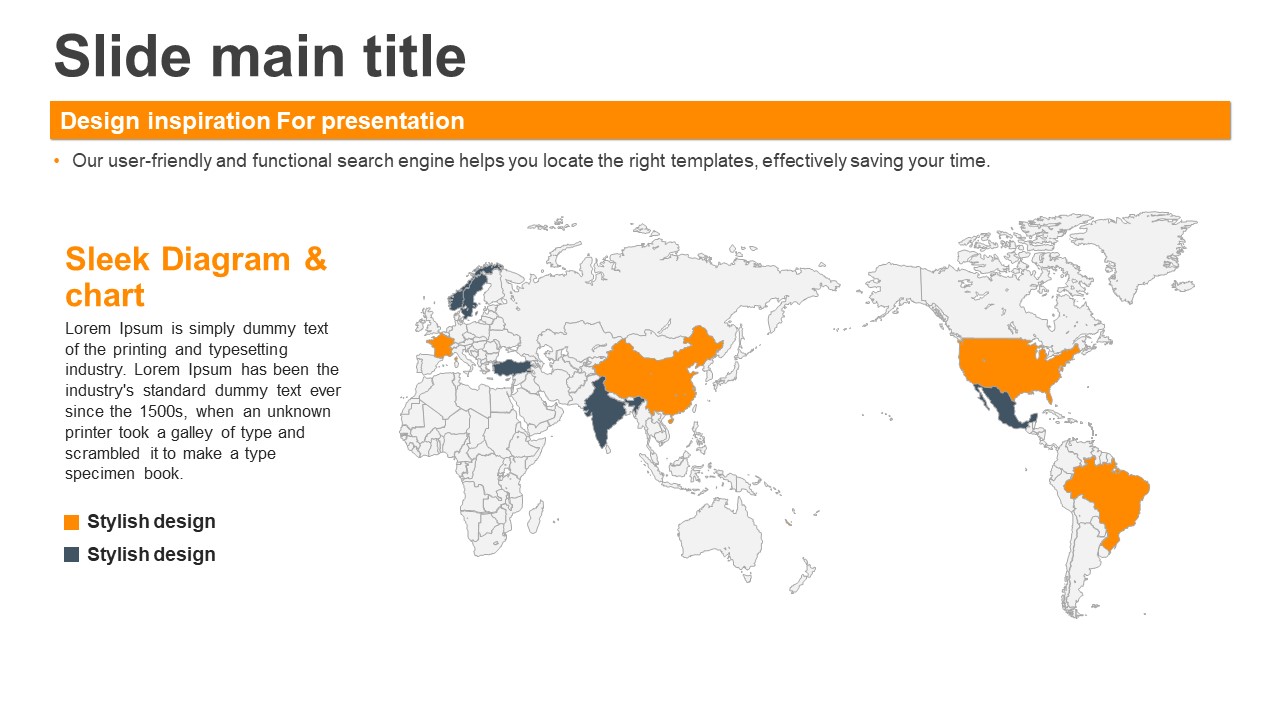
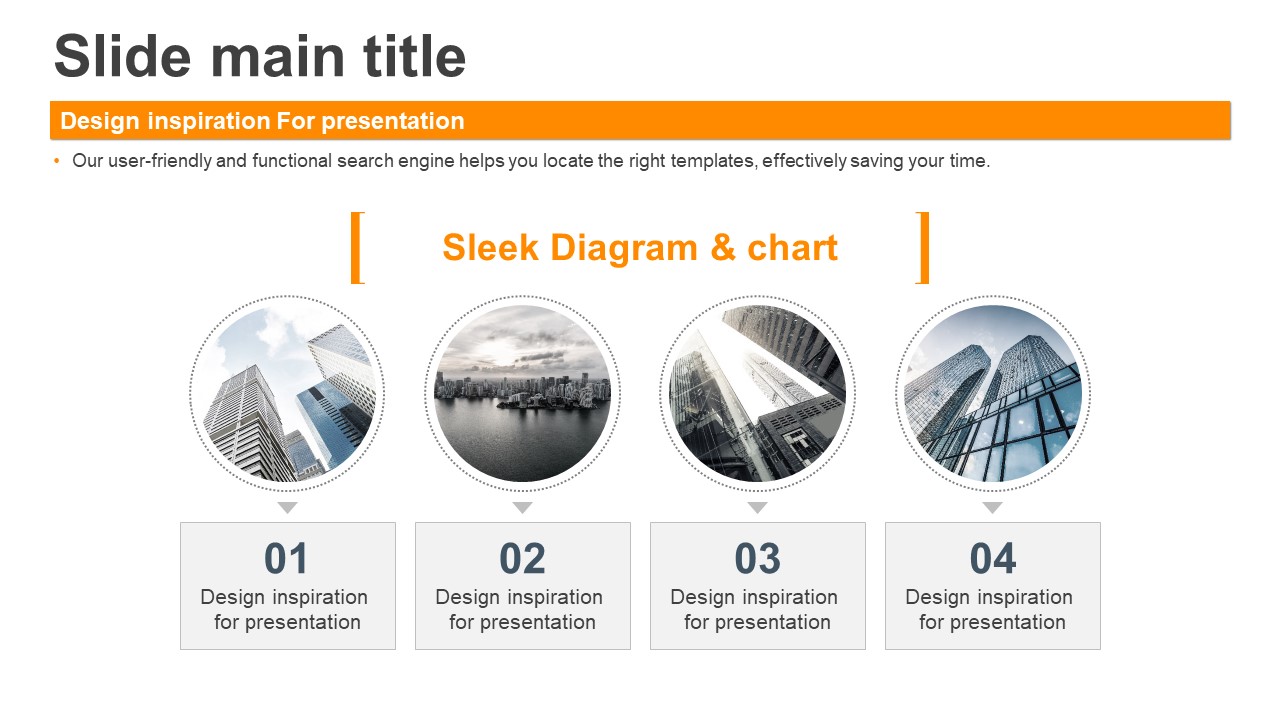
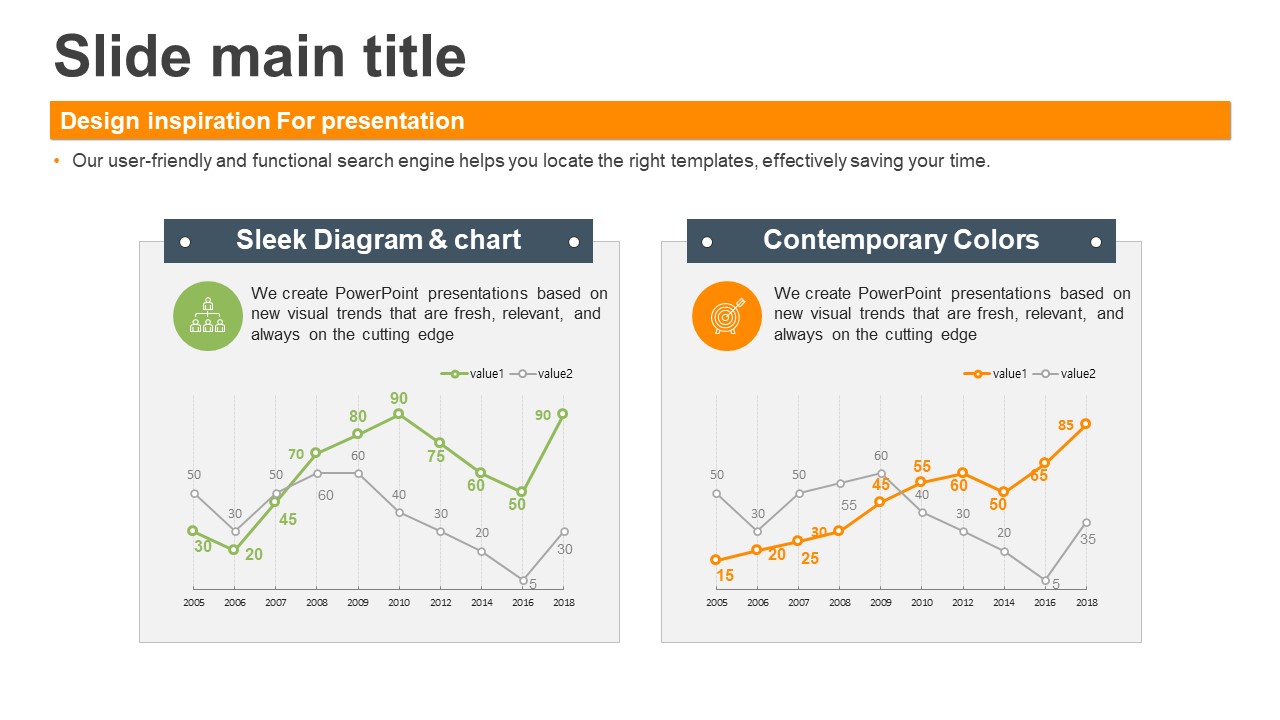
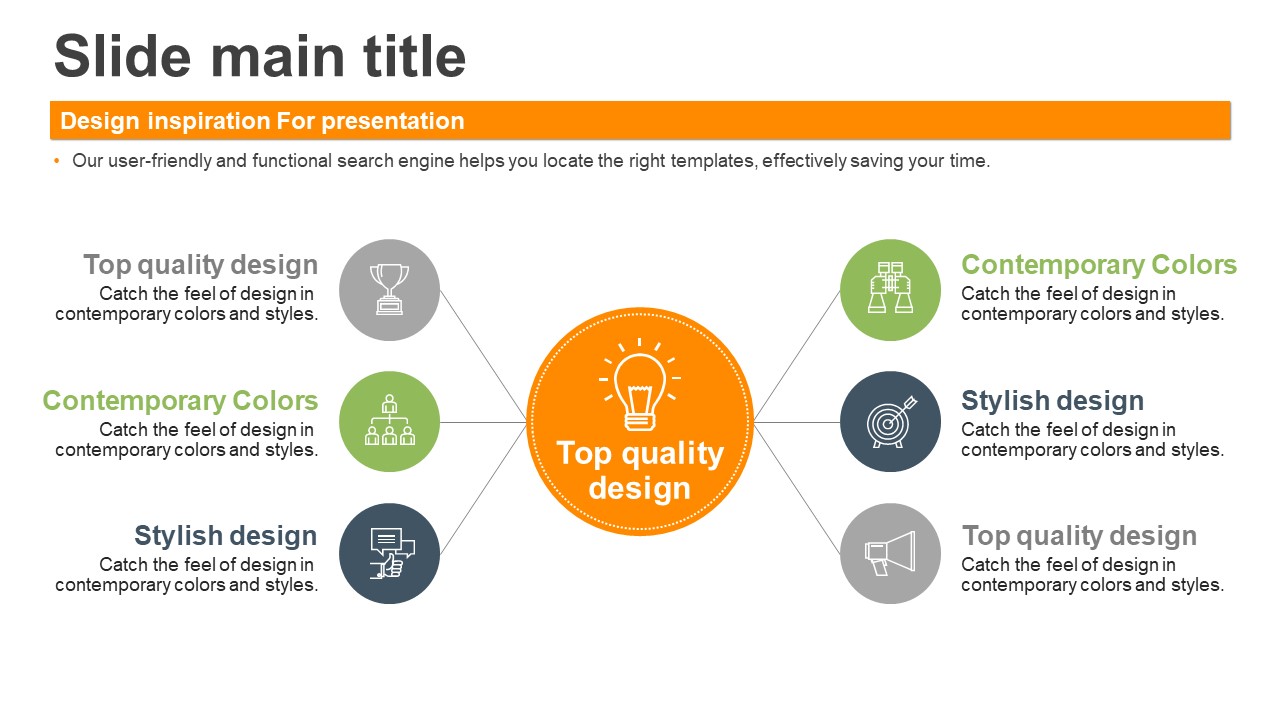
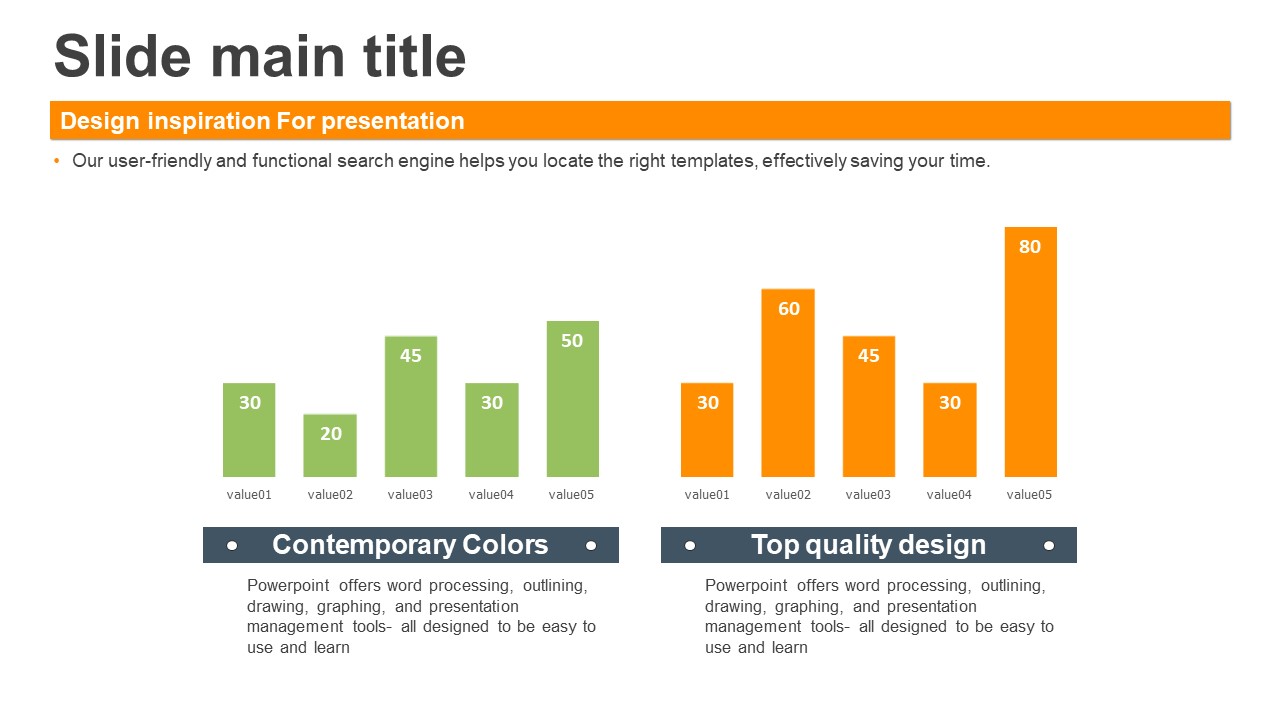
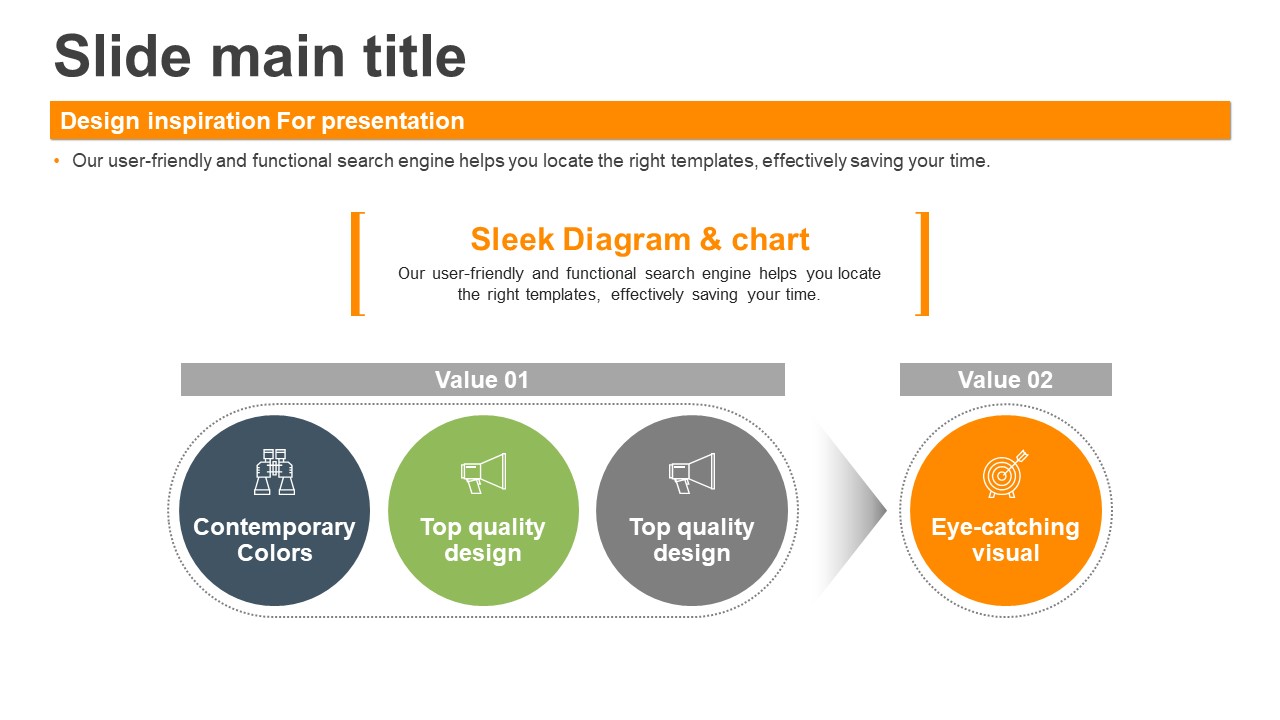
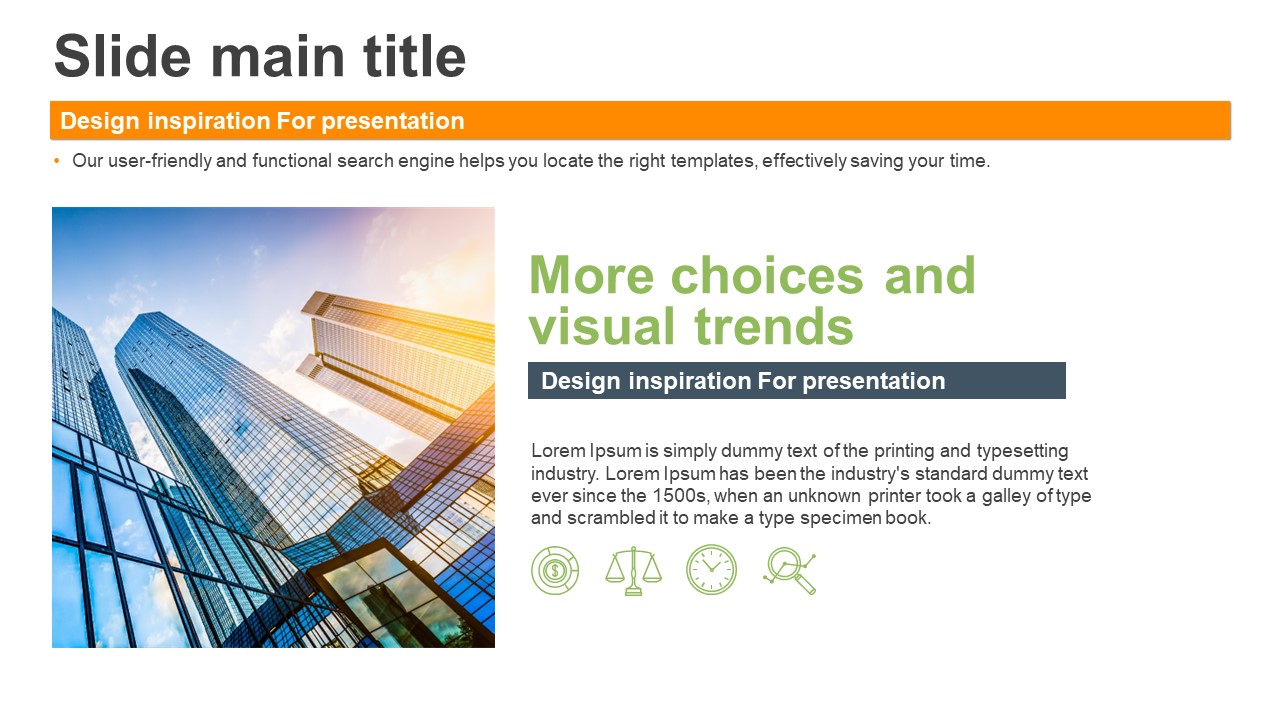
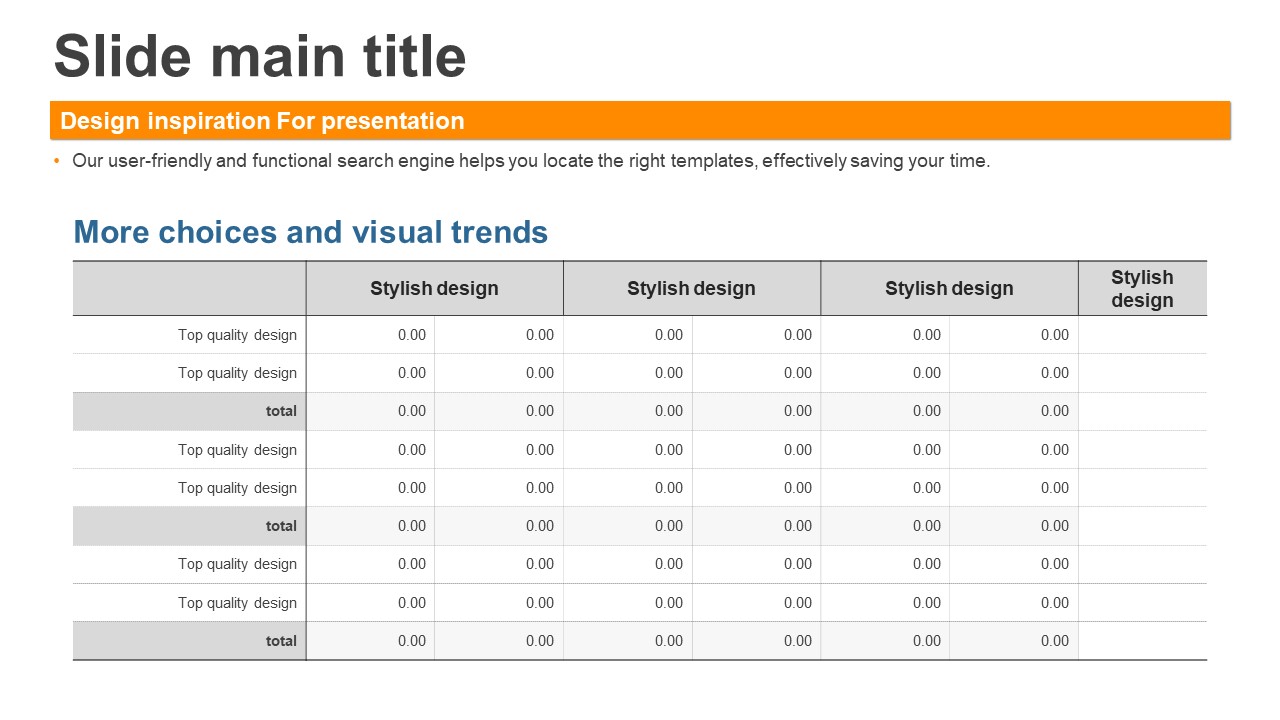
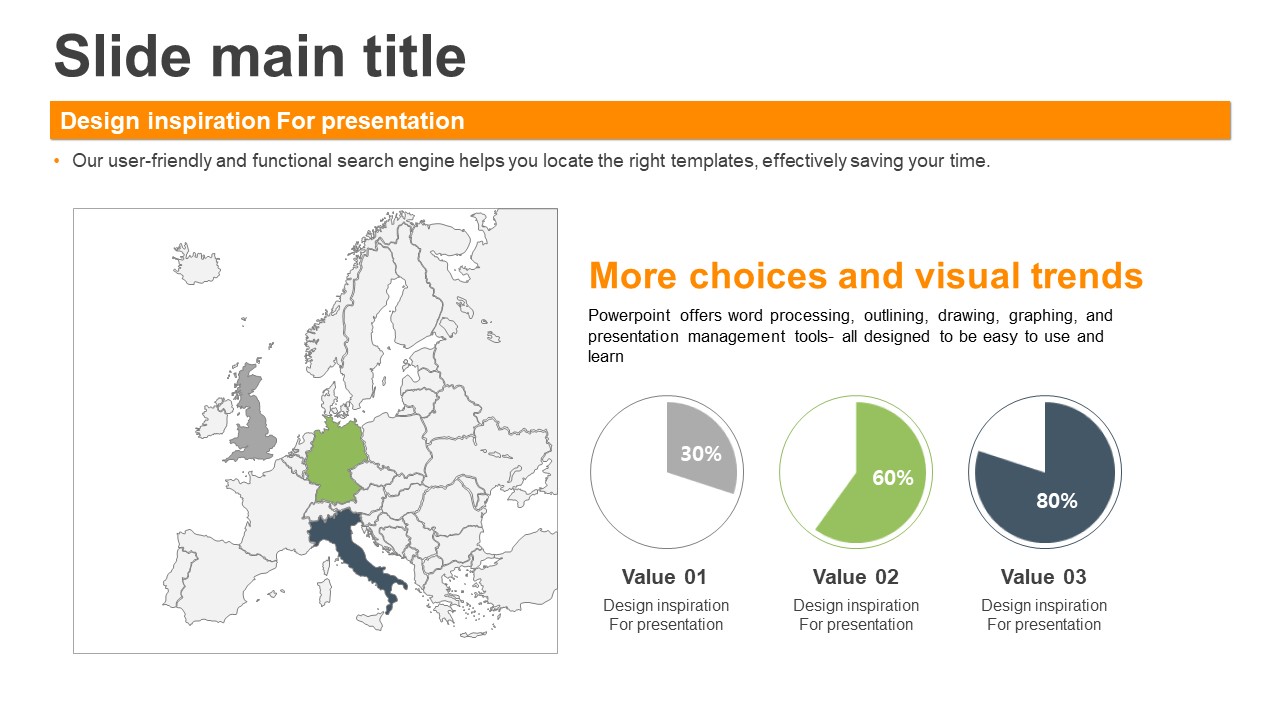
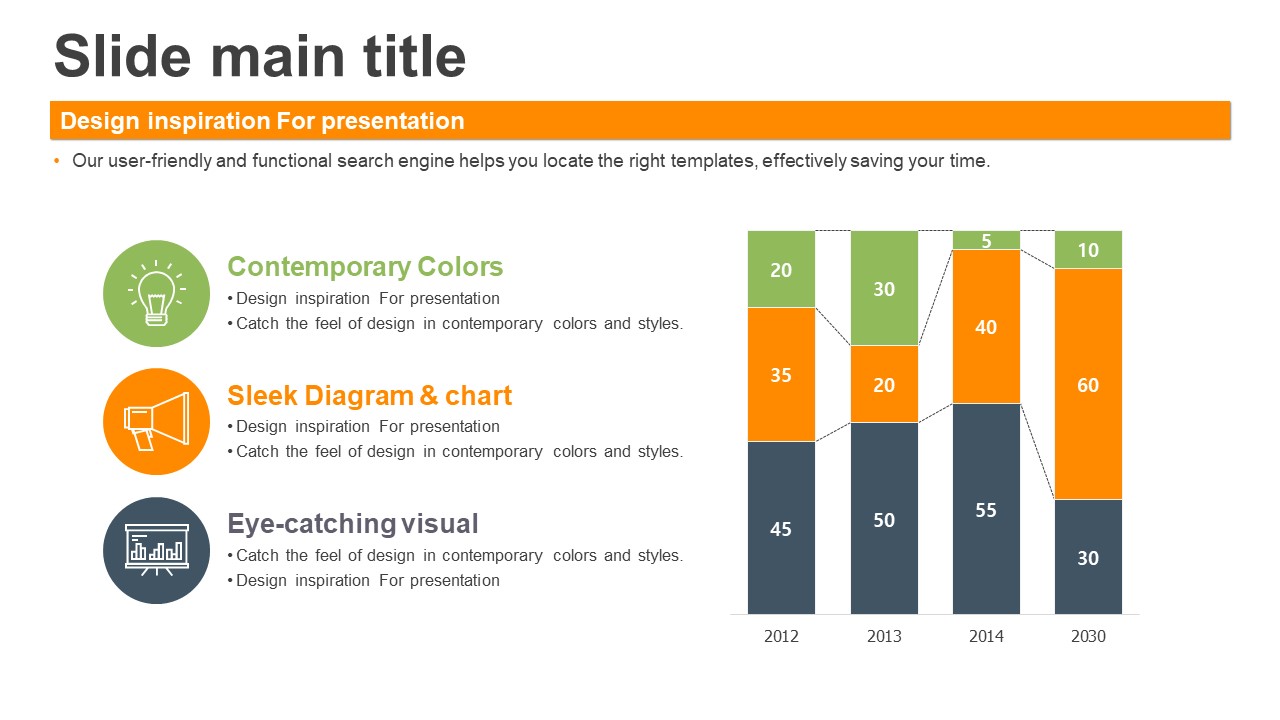
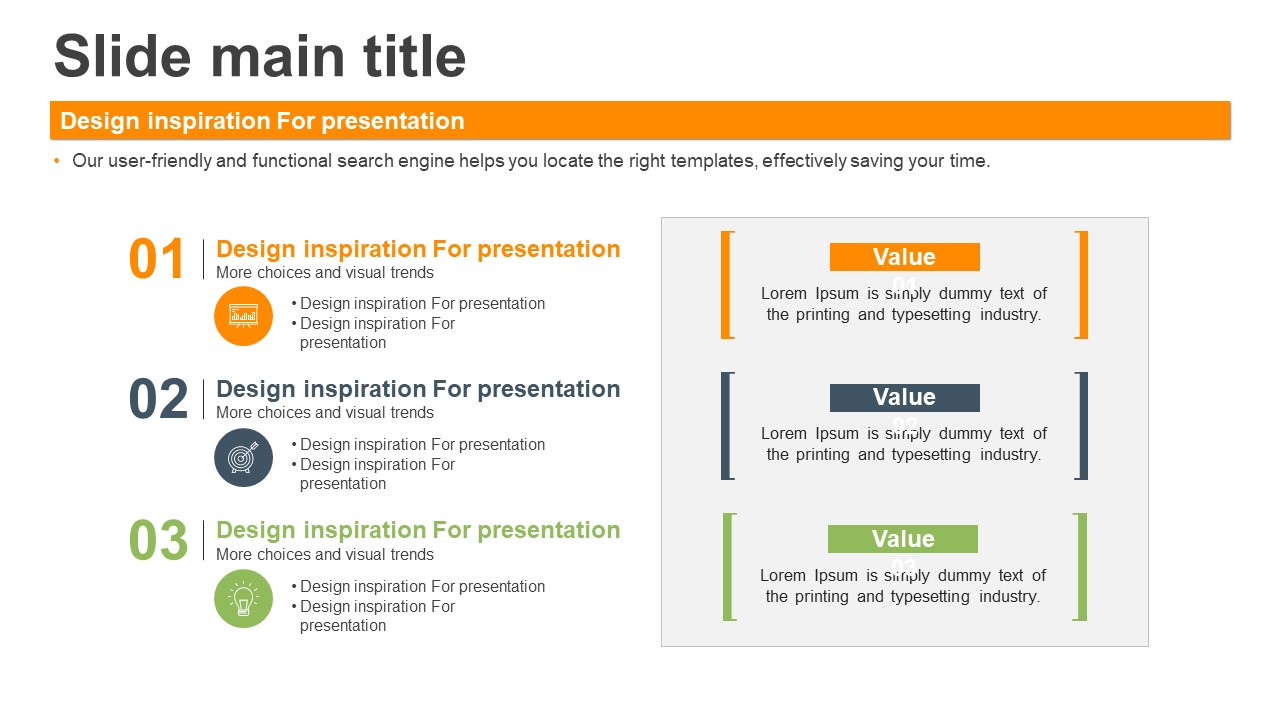
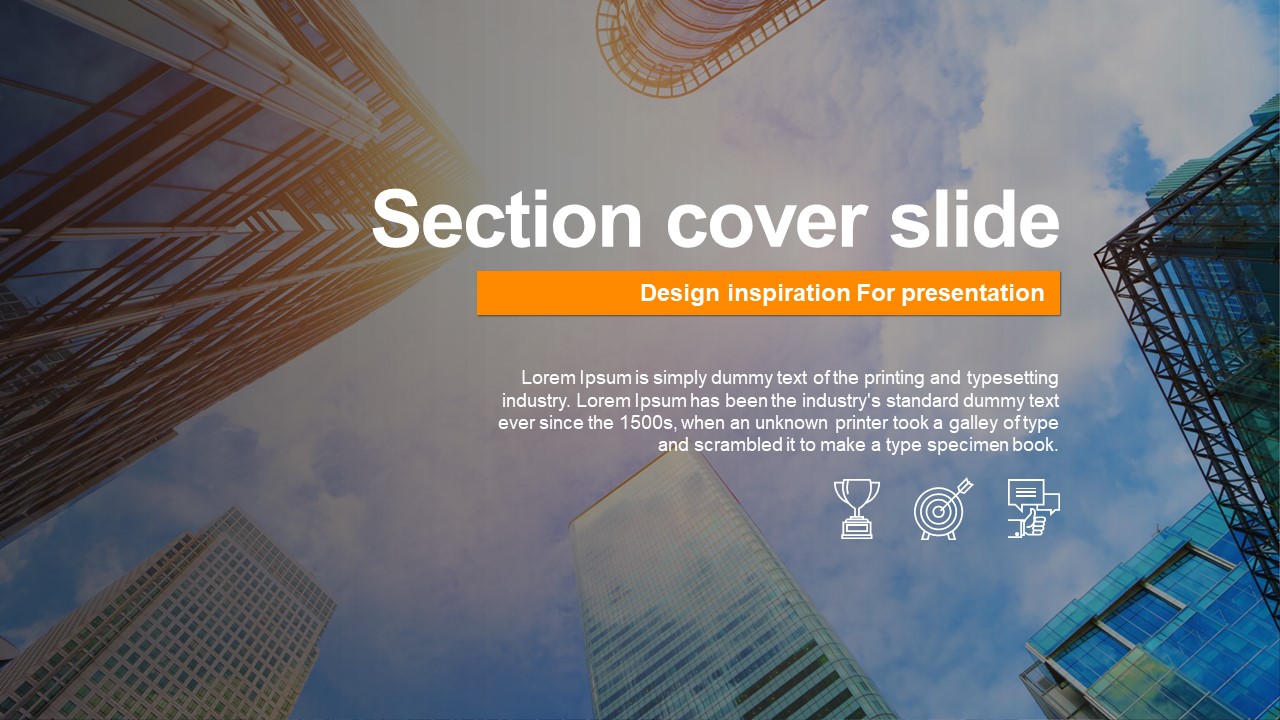
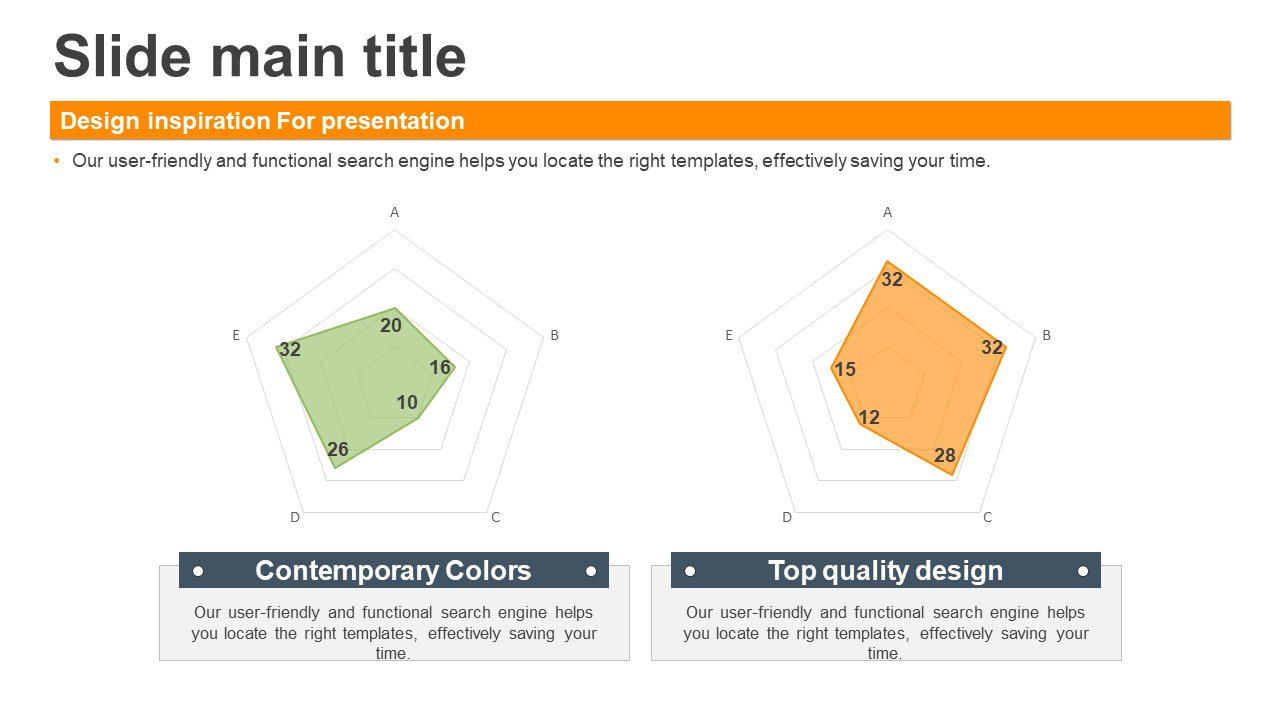
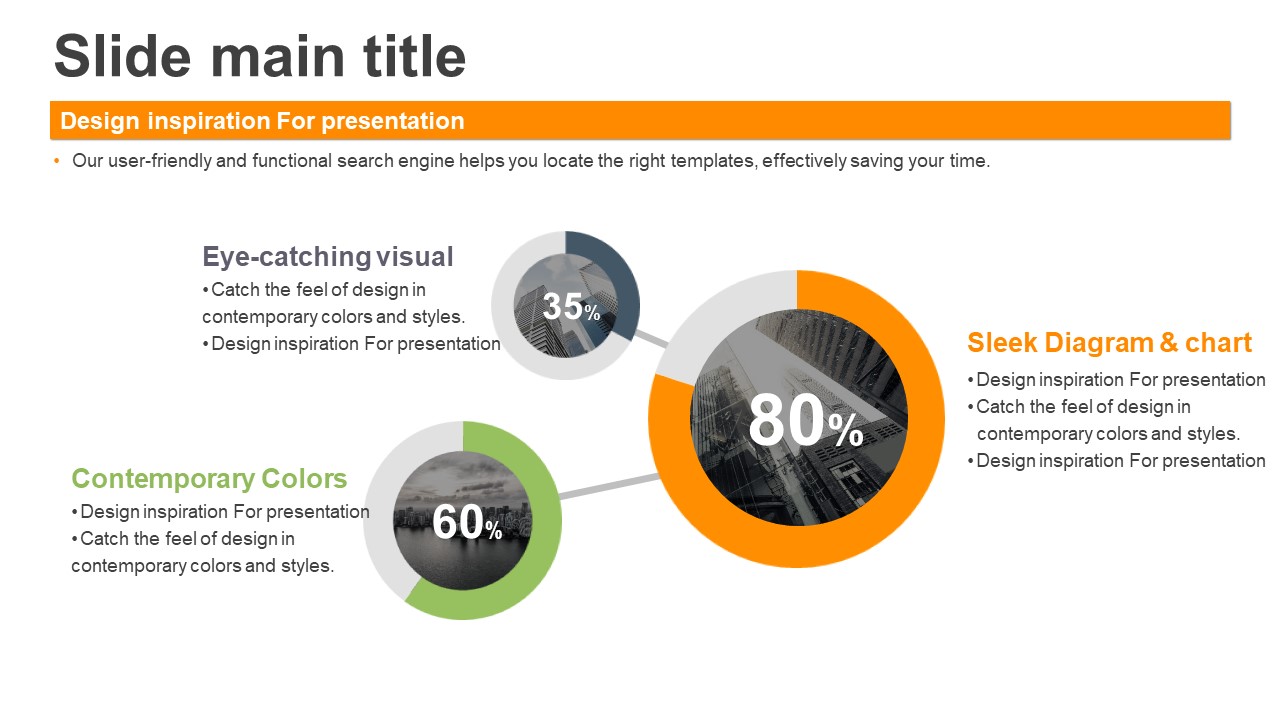
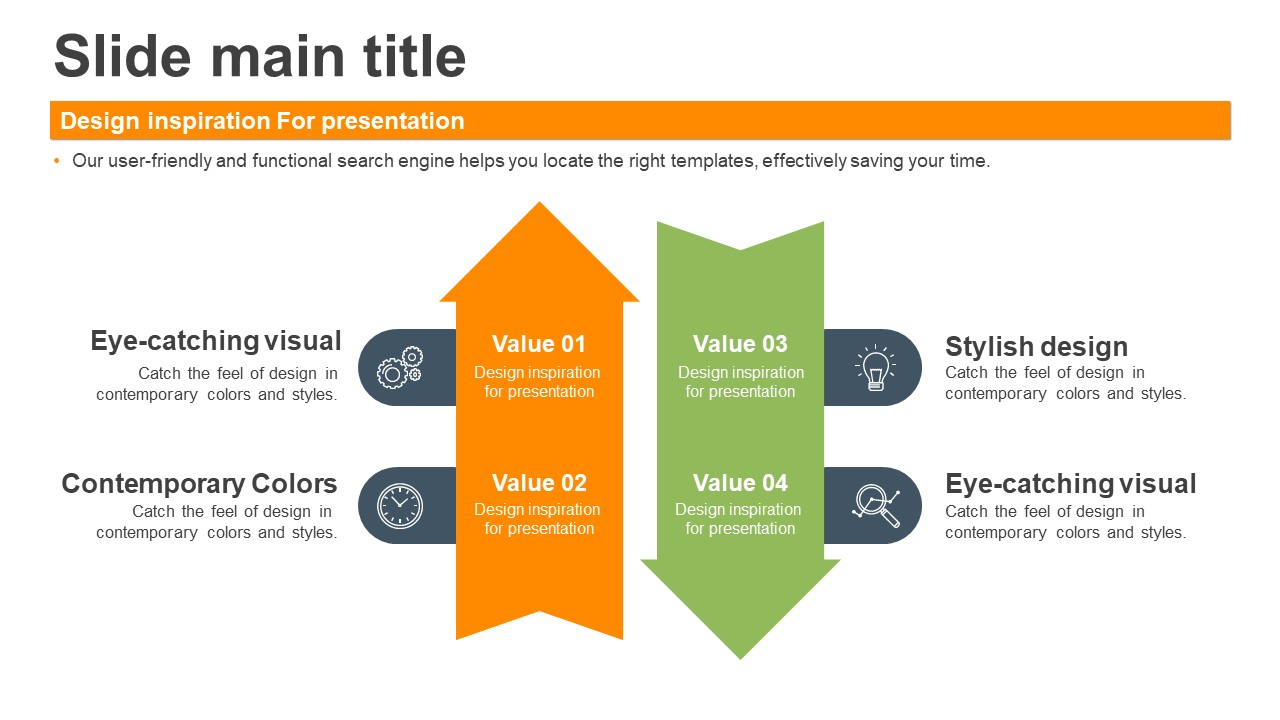
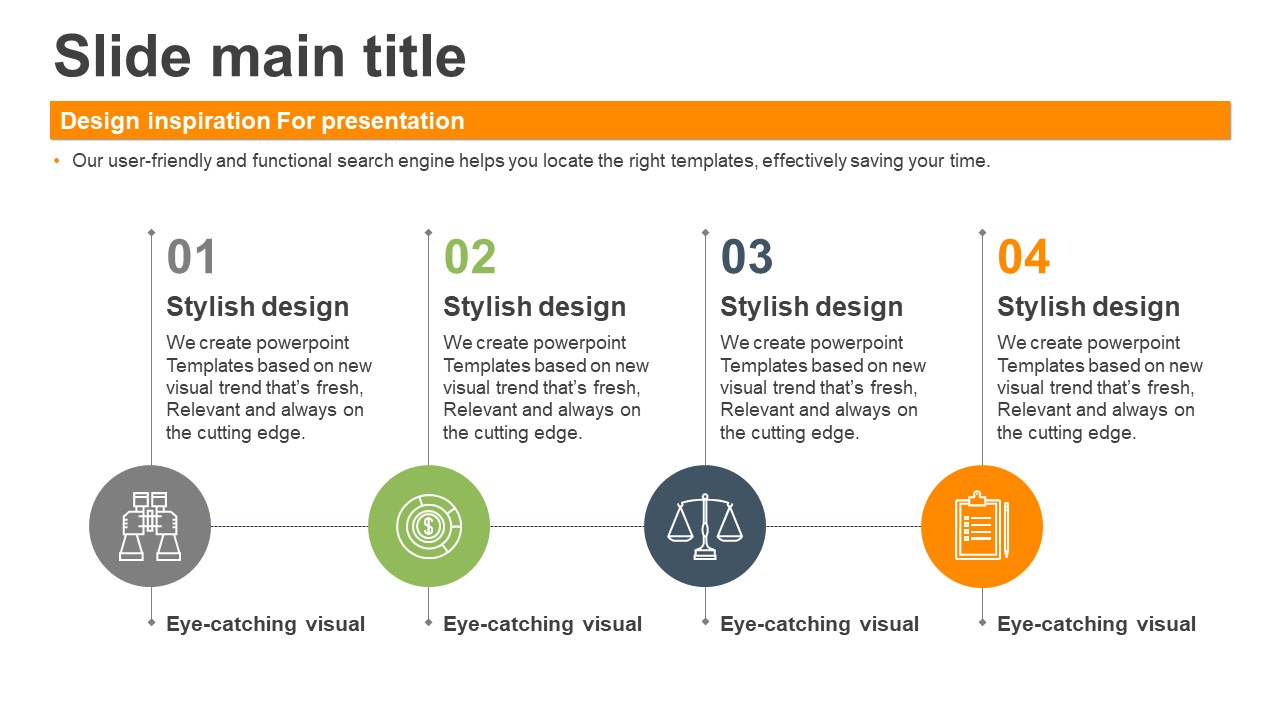
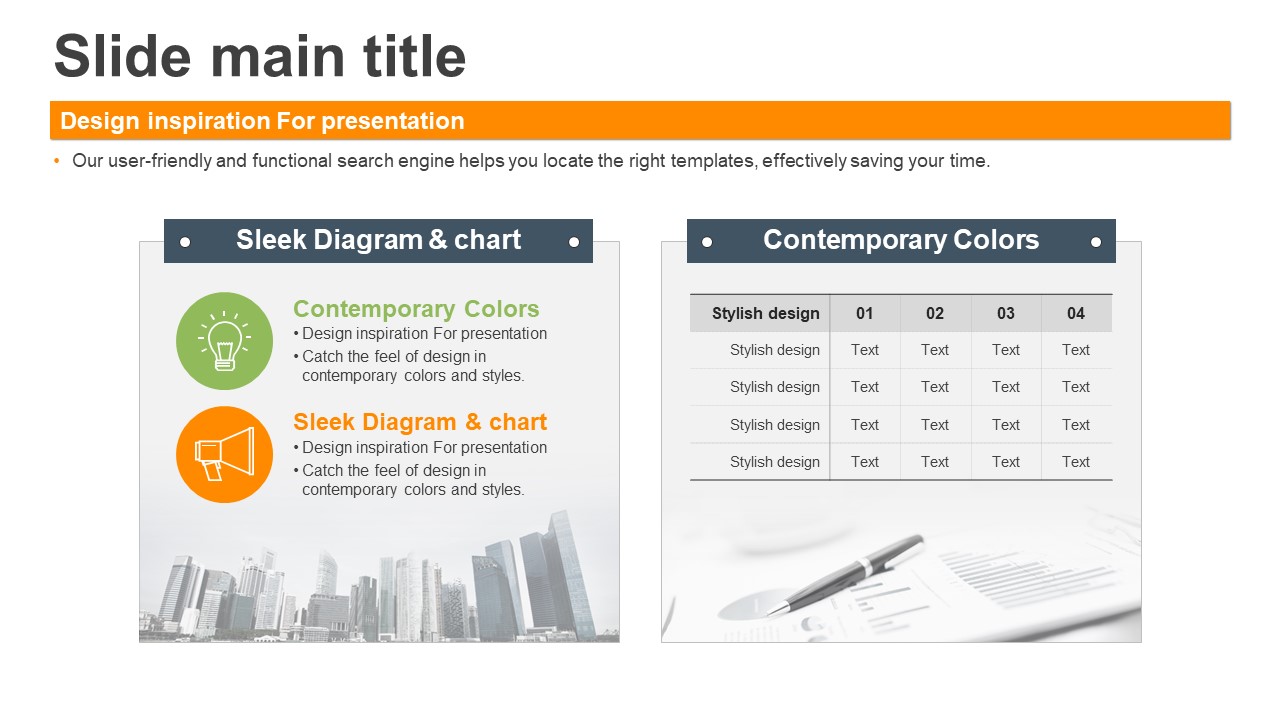
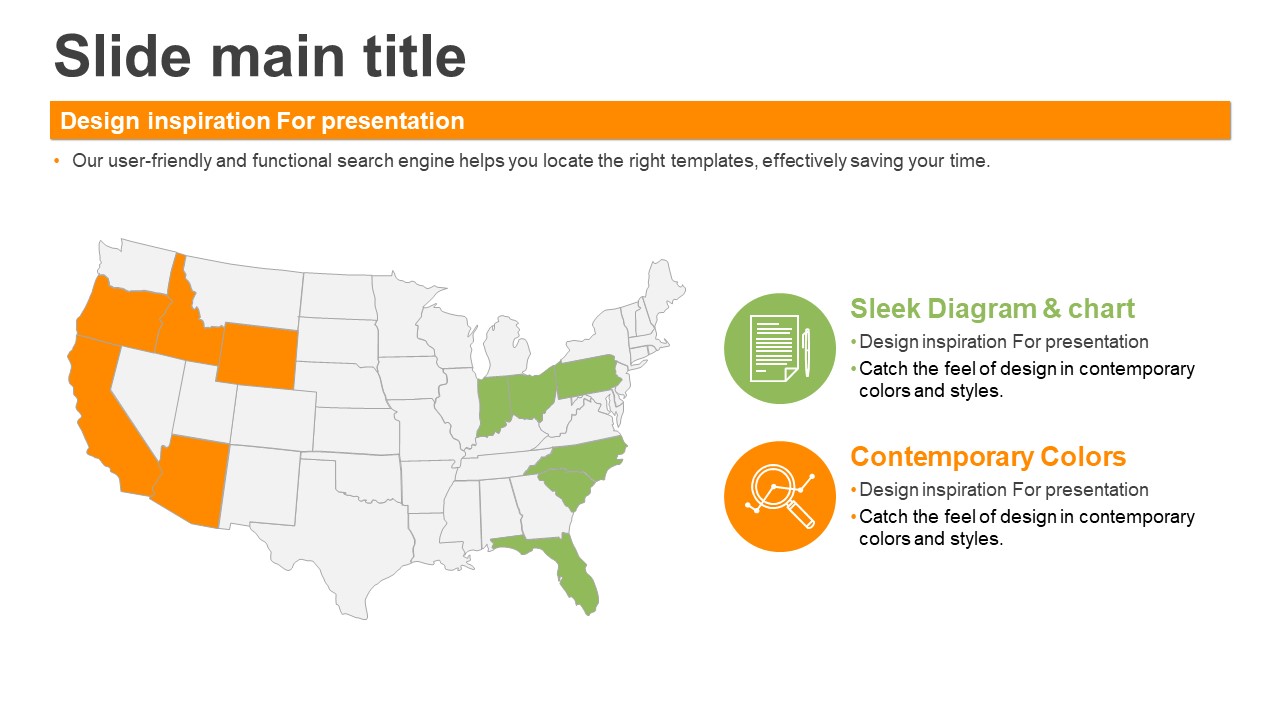
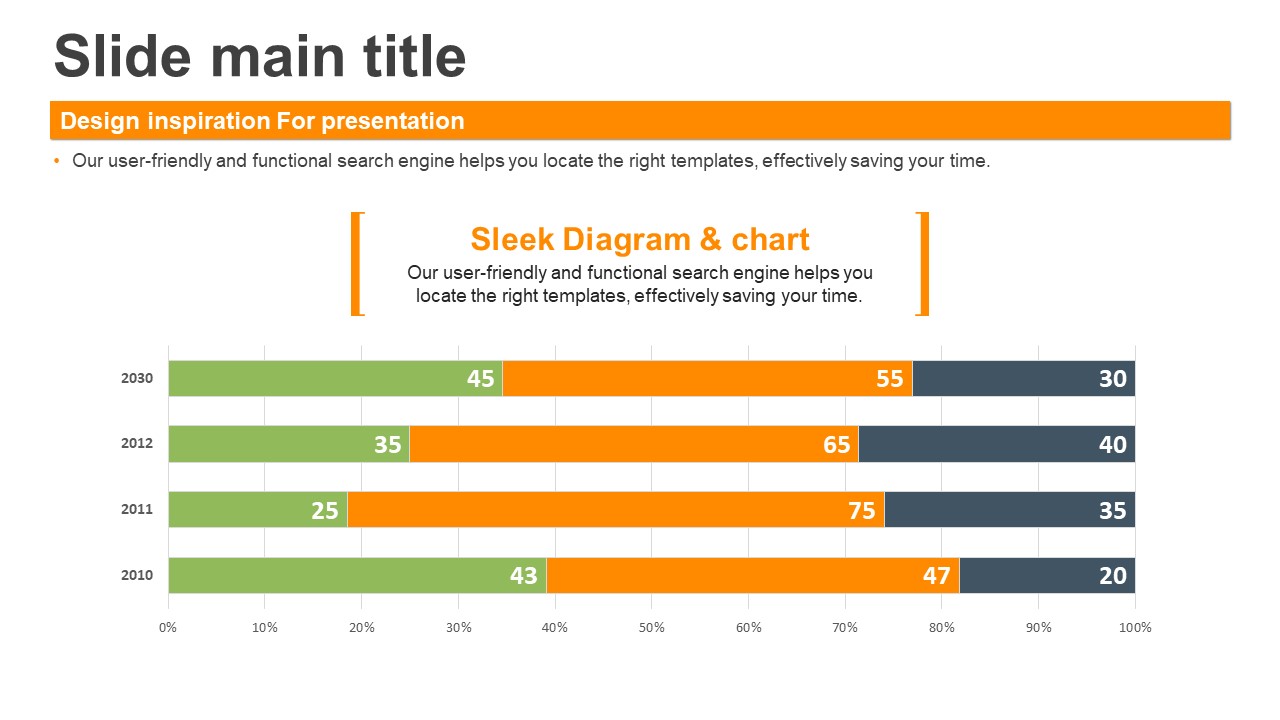
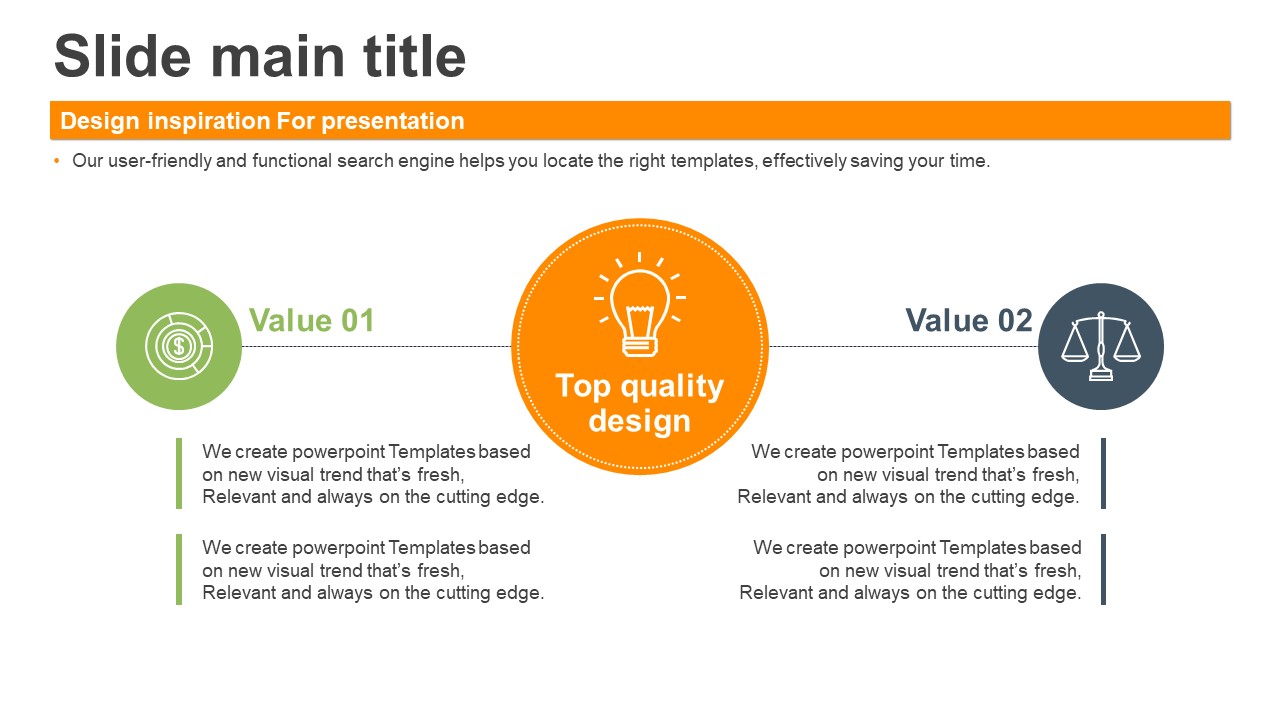
This corporate PowerPoint template features a full-bleed high-rise building photo on the cover slide, paired with a bold orange accent bar for section highlights and a clean white background throughout. Built on a two-column grid layout, it balances text, diagrams, charts, and photography to maximize information clarity in every presentation. The 31-slide set includes a radial icon diagram, dual line-graph comparison slides, a circular photo process flow, bar charts, and donut charts—giving you a complete toolkit for any business presentation. Whether you're pitching to investors, reporting quarterly results, or introducing your company to new partners, this PowerPoint deck adapts to your content with minimal editing. Simply download the PPTX file, swap in your text and images, and replace the orange accent with your brand color to create a polished, professional slide deck in minutes.
Usage Points
-
Main Usage
Designed for corporate presentations including company introductions, investor pitches, quarterly business reports, and partner briefings. The 31-slide structure covers all key sections of a professional business presentation, from opening visuals to data-driven charts.
-
How to Use
Download the PPTX file and open it in PowerPoint or a compatible application. Replace the cover building photo with your own image, update text placeholders with your content, and swap the orange accent color with your brand color to produce a fully customized presentation deck.
-
Recommended For
Ideal for corporate IR teams, sales and marketing managers, consultants, and executives preparing board-level or investor-facing presentations. Particularly well-suited for industries such as real estate, finance, construction, and professional services where credibility and visual impact matter.
-
Slide Structure
31 slides total: full-bleed building photo cover, radial 5-item icon diagram, dual line-graph comparison, 4-step circular photo process flow, grouped bar chart, and donut chart slides for percentage visualization—covering a wide range of data presentation needs.


