Competitor Comparison Line Graph
RJ0300064_11
- Last Update 05/05/2025
- File Size 0.8MB
- # of Slides 2
- File Format PPTX
- Slide Ratio 16:9
- Color
Keywords
About the Product
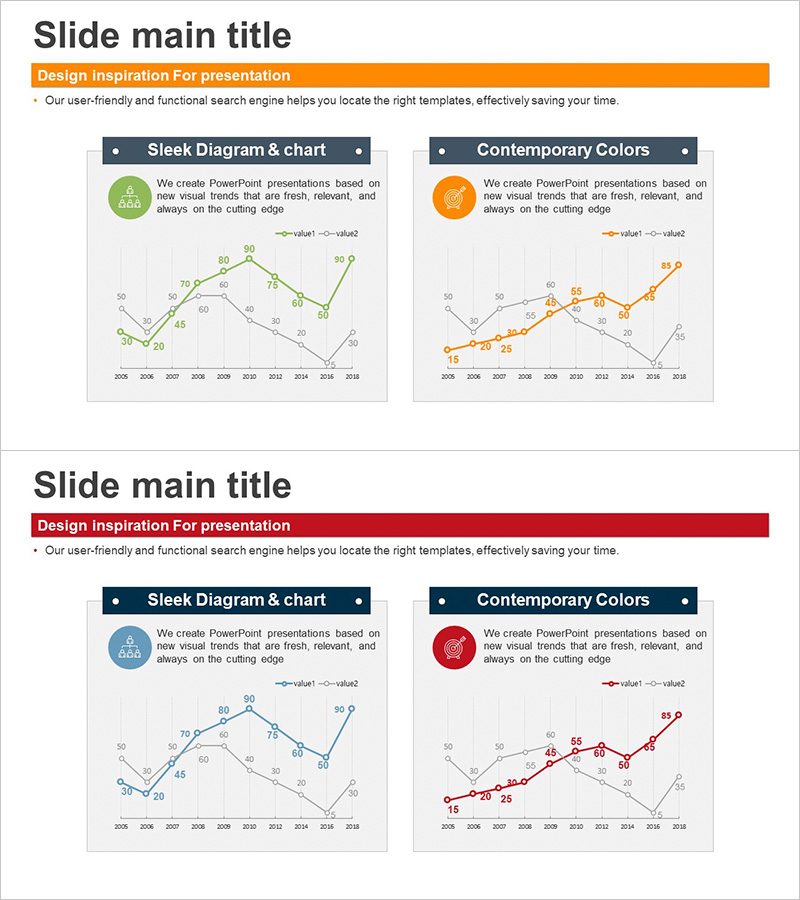
A PowerPoint slide featuring a dual-series line graph for comparing competitor performance over time. This presentation template visualizes 10-year trend data from 2008 to 2018 with two data series, available in four color options: green, orange, blue, and red. Each slide includes a circular icon and title area, making it ideal for competitive analysis, market share trends, revenue growth comparisons, and strategic presentations. The 16:9 widescreen PPTX format allows easy customization and data entry for immediate use in business reports.
Usage Points
-
Main Usage
Visualize competitive performance comparison across time periods to clearly communicate market position and trends. The dual-series line format enables simultaneous comparison of two competitors or metrics, effectively illustrating competitive advantage, growth rate differentials, and market share evolution.
-
How to Use
Integrate into business reports, investor pitch decks, marketing strategy meetings, and executive briefings within the competitive landscape analysis section. Input your data points and figures directly for real-time comparative analysis, and adjust colors to align with corporate branding guidelines for professional presentations.
-
Recommended For
Strategy planners, marketing professionals, executives, investor relations specialists, management consultants, and market analysts preparing competitive environment assessments. Particularly valuable for quarterly and annual performance reviews, competitor benchmarking studies, and market trend presentations.
-
Slide Structure
Each slide comprises a title area at the top, a circular color-coded icon on the left, and a central line graph. The graph features a horizontal axis showing years (2008–2018), a vertical axis with numerical scale, two data series lines (solid and dashed), data point markers, legend, and descriptive text areas for annotations.
Related Products
-

Default Line Graph for Market & Competitor Analysis – Competitive Advantage
#Market and Competitor Analysis #Graph #Competitor Analysis
-

Visualizing Menu Sales Status with Line Chart
#Market and Competitor Analysis #Graph #Competitor Analysis
-

Competitor Idea Analysis Graph
#Market and Competitor Analysis #Graph #Competitor Analysis
-

Broken Line Comparison Graph – Optimized for Market and Competitor Analysis
#Market and Competitor Analysis #Graph #Competitor Analysis
