Development Status Donut Graph – Market Share Visualization
RJ0300064_23
- Last Update 05/06/2025
- File Size 13.7MB
- # of Slides 2
- File Format PPTX
- Slide Ratio 16:9
- Color
Keywords
- #Content-Based Slides
- #Design-Based Slides
- #Product/Service Introduction
- #Market and Competitor Analysis
- #Diagram
- #Graph
- #Development Status
- #Market Share
- #Cluster
- #Circles
- #Chain Diagram
- #Doughnut Chart
- #16:9
- #donut chart PowerPoint slide
- #pie chart presentation template
- #market share visualization
- #proportion chart
- #donut graph download
About the Product
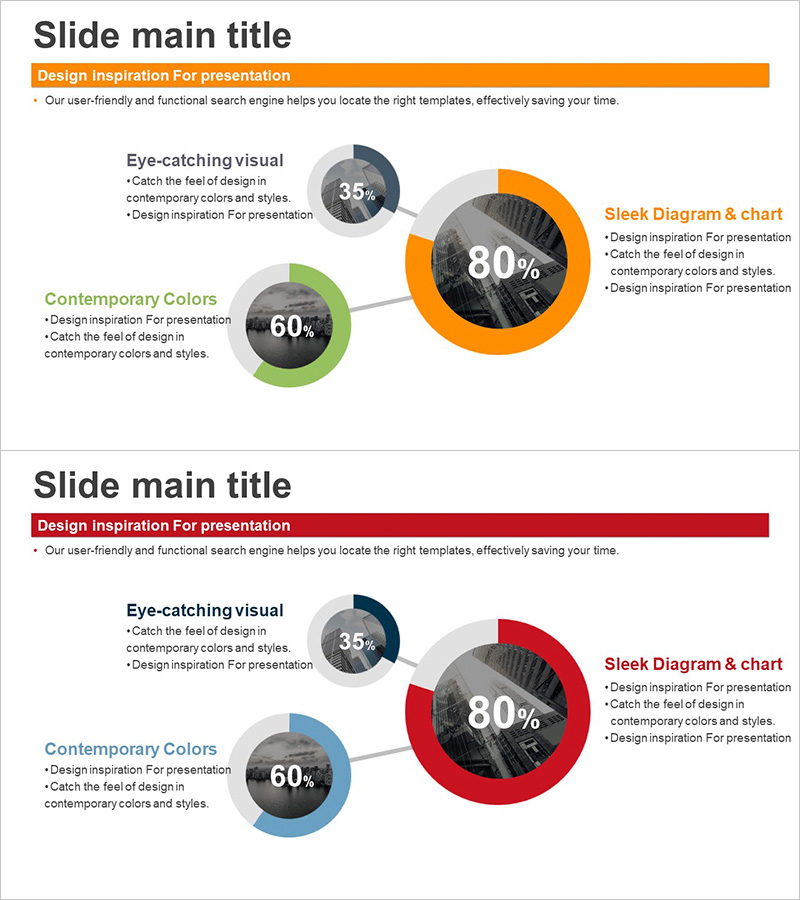
A PowerPoint slide featuring a 3-item donut chart that visualizes proportional data with clarity and impact. The chart uses three distinct colors—orange, green, and blue—to differentiate each segment, displaying percentages (80%, 60%, 35%) prominently within the chart. Text labels and description areas are positioned beside each donut segment, allowing you to add context and explanations. Ideal for business presentations covering market share, sales channel distribution, customer composition, budget allocation, and product portfolio breakdown. The 2-slide set is optimized for 16:9 widescreen format and ready for immediate customization.
Usage Points
-
Main Usage
Clearly communicate the proportional breakdown of three to four key components in business presentations. Perfect for illustrating market share, sales channel distribution, customer demographics, budget allocation, and product line composition.
-
How to Use
Replace the sample percentages with your actual data values. Edit the text labels and descriptions beside each donut segment to match your content. Customize colors to align with your corporate branding. Duplicate the slide layout to show comparative data across different time periods or scenarios.
-
Recommended For
Marketing professionals presenting market analysis, sales teams reporting performance metrics, executives explaining business structure to stakeholders, investors seeking portfolio overview, and product managers introducing product mix composition.
-
Slide Structure
2-slide layout. Each slide contains a 3-segment donut chart with percentage labels (80%, 60%, 35%), a header bar in orange or red, a title area, and text zones positioned beside each chart segment for detailed explanations and context.
Related Products
-

Development Status Analysis Connection Diagram – Effective Information Delivery
#Product/Service Introduction #Market and Competitor Analysis #Diagram
-

System Development Status Graph – Visualizing Market Share
#Product/Service Introduction #Market and Competitor Analysis #Diagram
-

Aviation Service Development Schedule Donut Circle Graph
#Product/Service Introduction #Market and Competitor Analysis #Diagram
-

Magic Donut Chart for Market Share Visualization – Key Information Delivery
#Product/Service Introduction #Market and Competitor Analysis #Diagram
