Target Area Market Share Analysis Graph – Emphasizing Market Competition
RJ0300064_18
- Last Update 05/05/2025
- File Size 0.6MB
- # of Slides 2
- File Format PPTX
- Slide Ratio 16:9
- Color
Keywords
About the Product
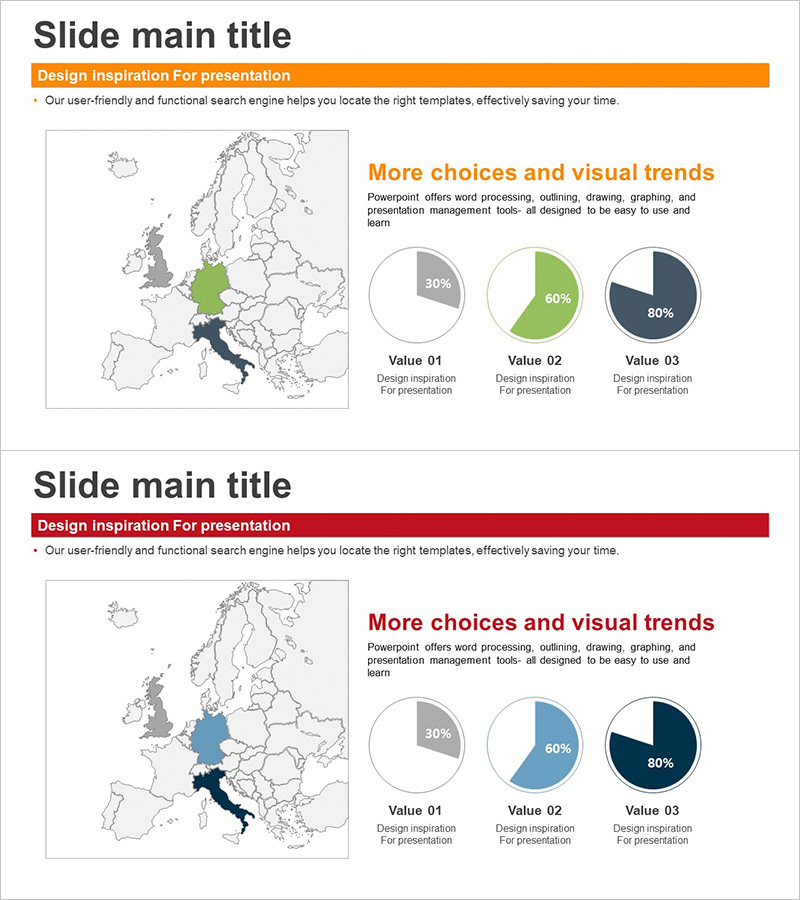
A 2-slide PowerPoint presentation for analyzing European market share with visual clarity and geographic context. The slide combines a world map with highlighted target countries on the left and three pie charts on the right, each displaying market share percentages (30%, 60%, 80%) in distinct colors: orange, green, and navy blue. This slide deck is ideal for presentations, marketing strategy documents, and competitive analysis reports where regional data visualization is essential. The 16:9 widescreen format ensures compatibility with modern projectors and online presentation platforms, making it ready to use immediately after data customization.
Usage Points
-
Main Usage
Visualize regional and country-level market share comparisons using an integrated map and pie chart layout to clearly communicate competitive landscape and market strategy. Particularly effective for investor presentations, executive briefings, and marketing strategy development where geographic data analysis is critical.
-
How to Use
Highlight target regions on the world map using color coding on the left side, then input corresponding market share percentages into the three pie charts on the right. Replace the sample data (30%, 60%, 80%) with your actual figures, adjust the legend labels, and customize the color palette to match your organization's branding guidelines.
-
Recommended For
Marketing managers, business development teams, executives, investor relations professionals, and management consultants. Suitable for regional market analysis, global expansion strategy presentations, competitive benchmarking, quarterly performance reports, and any presentation requiring geographic data emphasis.
-
Slide Structure
Slide 1: Orange header + world map with 2 highlighted target countries + 3 pie charts on right (30%, 60%, 80% data) / Slide 2: Navy blue header + identical layout with color variation (blue, green, navy accents) + 3 editable pie charts. Each chart is independently editable with clearly marked data input fields for seamless customization.
Related Products
-

Asia Map Presentation Template - Market Share Analysis
#Market and Competitor Analysis #Graph #Other
-

Orange Hexagon Template World Map – Market Analysis Insights
#Market and Competitor Analysis #Graph #Other
-

Market Share Visualization of Three Countries – Effective Data Analysis
#Market and Competitor Analysis #Graph #Other
-

Pie Chart of Camping Business Market Share by European Country
#Market and Competitor Analysis #Graph #Other
