Diffusion Diagram with Center for Business Area Presentation
RJ0300064_13
- Last Update 05/05/2025
- File Size 0.1MB
- # of Slides 2
- File Format PPTX
- Slide Ratio 16:9
- Color
Keywords
- #Content-Based Slides
- #Design-Based Slides
- #Company Introduction
- #Business Introduction
- #Diagram
- #Business Areas
- #Business Areas
- #Cluster
- #Spread
- #Chain Diagram
- #16:9
- #radial diagram PowerPoint
- #central diffusion diagram slide
- #6-node diagram template
- #business area presentation slide
- #how to create radial diagram in PowerPoint
About the Product
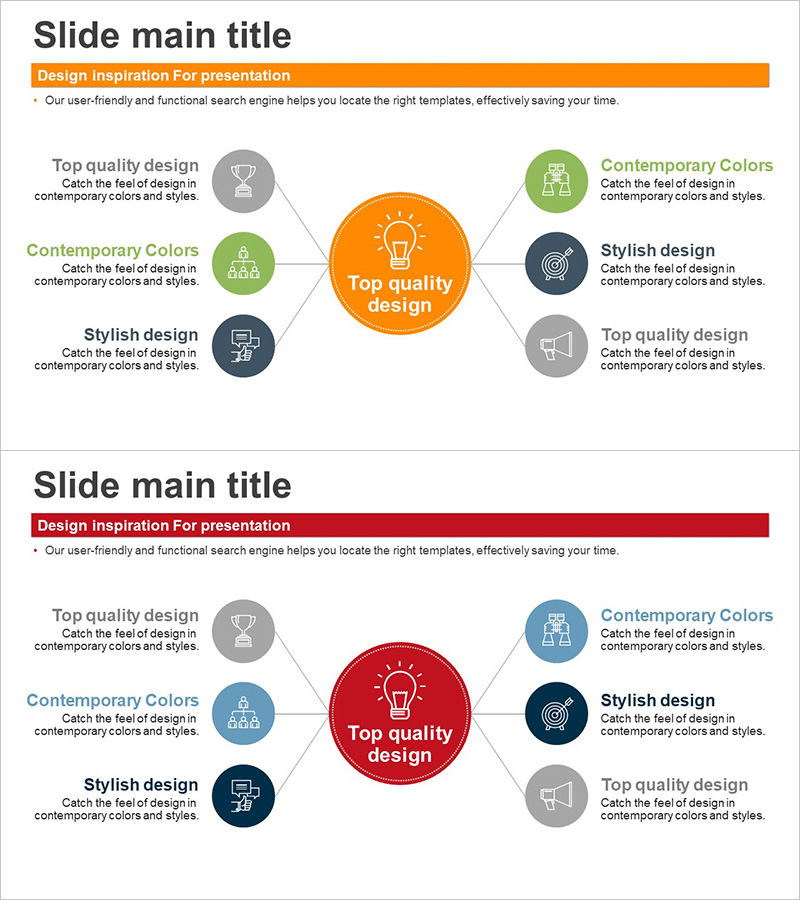
A PowerPoint slide featuring a central hub with six nodes radiating outward in a diffusion pattern. Designed in orange and red color schemes with icons and text areas in each node. Perfect for visualizing business areas, core values, strategic initiatives, and organizational relationships. The 2-slide set comes in 16:9 widescreen PPTX format and is fully editable to match your presentation needs. This radial diagram effectively communicates how central concepts connect to and influence multiple surrounding elements.
Usage Points
-
Main Usage
Illustrates how a central concept, vision, or strategy branches into multiple supporting areas or execution tasks. Effectively communicates organizational structure, business domains, marketing strategies, product portfolios, and hierarchical relationships between core and supporting elements.
-
How to Use
Enter your main topic in the central circular node (e.g., company vision, core values, business objective). Add supporting details to the six surrounding nodes. Customize icons and text for each node to match your content. Colors and styling can be easily adjusted to fit your brand guidelines.
-
Recommended For
Executive reports, business plans, organizational overviews, marketing strategy presentations, product portfolio introductions, investor pitch decks, and strategic planning documents where you need to show relationships between a central concept and multiple supporting elements.
-
Slide Structure
Two-slide set with distinct color variations. First slide features an orange central node connected to six gray peripheral nodes. Second slide shows a red central node connected to six nodes in mixed blue and gray tones. Each node includes dedicated icon and text input areas for easy customization.
Related Products
-

Visualizing PC Data Analysis Business Area PPT – Cluster and Connection
#Company Introduction #Business Introduction #Diagram
-

Business Value Diagram – Visualizing Business Sectors
#Company Introduction #Business Introduction #Diagram
-

Business Area Diffusion Diagram – Directions for Business Development
#Company Introduction #Business Introduction #Diagram
-

Business Activity Areas Diagram – Visual Design for Business Success
#Company Introduction #Business Introduction #Diagram
