Visualizing Financial Performance with Business Table Chart – Intuitive and Effective
RJ0300064_17
- Last Update 05/05/2025
- File Size 0.9MB
- # of Slides 2
- File Format PPTX
- Slide Ratio 16:9
- Color
Keywords
- #Content-Based Slides
- #Design-Based Slides
- #Financial Plans and Performance
- #Diagram
- #Income Statement
- #Key Financial Indicators
- #Table
- #Standard Table
- #16:9
- #financial table PowerPoint
- #financial performance slide template
- #data comparison table
- #income statement PPT
- #financial metrics chart
- #business table diagram PowerPoint
About the Product
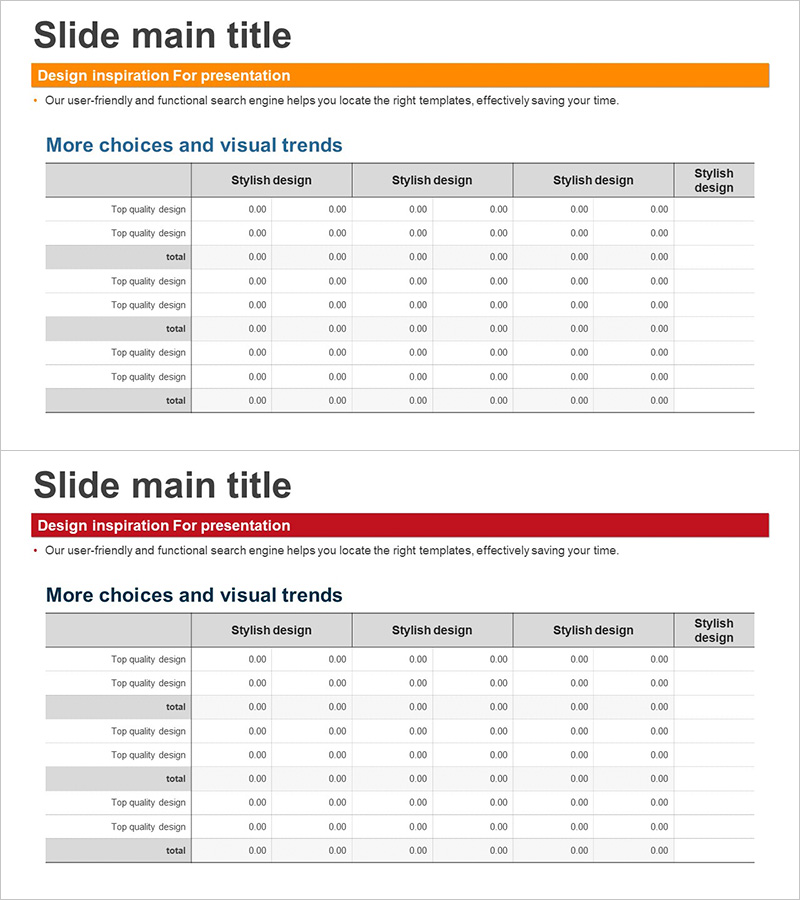
A table-formatted PowerPoint slide designed to present business financial data intuitively and effectively. The 6-column structure with orange and red header colors emphasizes financial metrics, quarterly performance, and profit-and-loss items for clear comparison. The 2-slide set includes multiple data entry areas that allow you to input actual figures directly. This presentation template is ready to use for financial status reports, budget planning presentations, and performance analysis meetings.
Usage Points
-
Main Usage
Compare and analyze financial data, quarterly performance, profit-and-loss items, and budget versus actual results using a structured row-and-column layout. Present numerical information systematically to support decision-making.
-
How to Use
Use in executive reports, financial briefings, quarterly performance presentations, and investor relations meetings to explain financial status. Input actual figures into each cell and adjust colors as needed to highlight key items.
-
Recommended For
CFOs, finance teams, executives, investor relations managers, and business planning teams presenting financial performance or budget plans. Particularly useful for quarterly and annual performance analysis presentations.
-
Slide Structure
2-slide set. Each slide features a table with 6 columns and multiple rows. Headers are highlighted with orange or red backgrounds, while data entry areas use white or light gray backgrounds for distinction. Includes a total row for summary calculations.
Related Products
-

Key Financial Indicators Table – Clear Profit Analysis
#Financial Plans and Performance #Diagram #Income Statement
-

Income Statement Table – Clearly Presenting Financial Plans and Performance
#Financial Plans and Performance #Diagram #Income Statement
-

Paper Theme Key Financial Indicators Slide
#Financial Plans and Performance #Diagram #Income Statement
-

Insight Summary Table – Visualizing Financial Plans and Performance
#Financial Plans and Performance #Diagram #Income Statement
