Business Process Steps – Planning and Execution
RJ0300064_3
- Last Update 05/06/2025
- File Size 0.1MB
- # of Slides 2
- File Format PPTX
- Slide Ratio 16:9
- Color
Keywords
- #Content-Based Slides
- #Design-Based Slides
- #Business Vision and Strategy
- #Operational Plan
- #Diagram
- #Business Goals
- #Business Processes
- #Flow
- #Linear Flow
- #16:9
- #3-step process flow diagram PowerPoint
- #business process diagram slide template
- #workflow steps presentation
- #linear flow chart PPT slide
- #process flow PowerPoint template download
About the Product
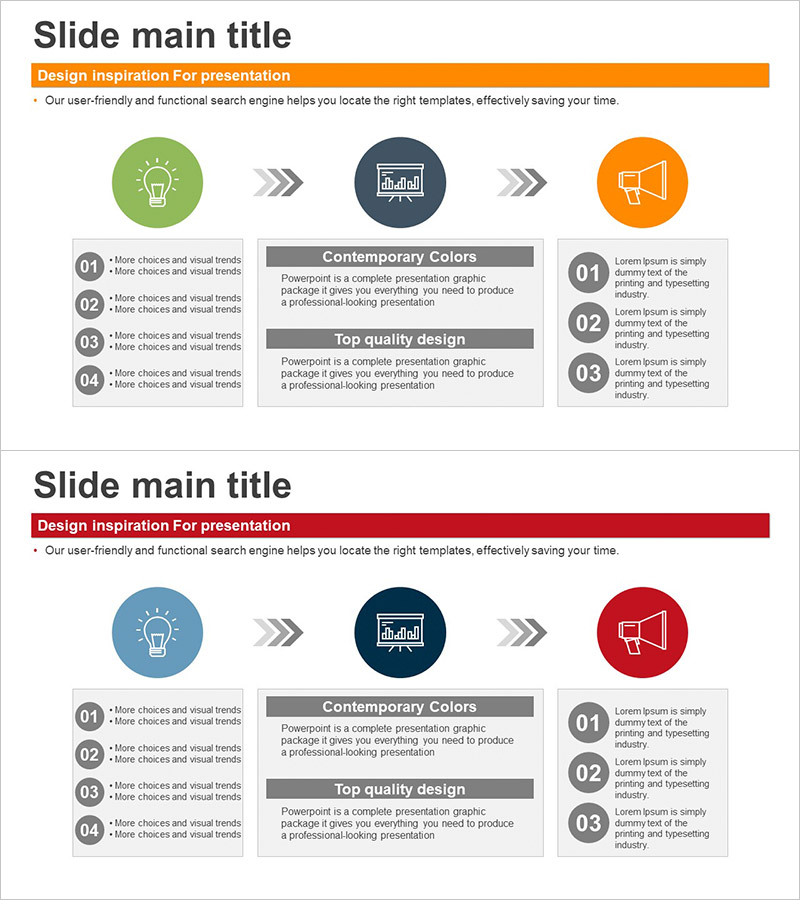
A PowerPoint slide visualizing a 3-step business process flow from ideation to execution. The linear diagram uses circular icons connected by arrows to clearly represent workflow steps, operational strategies, and project phases. The two-tone color scheme of orange and blue distinguishes each stage, while the left-side numbered list and right-side description area organize information systematically. The 2-slide set enables flexible representation of various process flows and is ready for immediate editing in PPTX format.
Usage Points
-
Main Usage
Visualize business processes, workflow steps, and operational strategies as a 3-step linear flow to clearly communicate sequential progression to audiences. Emphasize the journey from initial ideation to final execution while allowing detailed explanation of each stage's objectives and activities.
-
How to Use
Enter stage-specific concepts inside each circular icon and add detailed content to the left-side numbered list. Write stage objectives, activities, and deliverables in the right-side description area to enhance audience comprehension. Customize colors and icons to match your organization's branding guidelines.
-
Recommended For
Executives, project managers, and operations professionals presenting business strategies, project implementation plans, and process improvement initiatives. Ideal for business plans, strategy reports, operational guides, and training materials.
-
Slide Structure
2-slide set. Each slide features 3 circular icons (green, gray, orange) connected by arrows in a linear flow, a left-side 4-item numbered list, and a right-side description text area. Optimized for 16:9 widescreen format.
Related Products
-

Diagram-based Wealth-Building Financial Planning Strategy – Setting Goals for Success
#Business Vision and Strategy #Operational Plan #Diagram
-

Modern Design Slide Template for Visualizing Progress
#Business Vision and Strategy #Operational Plan #Diagram
-

Energy Saving Processes in Everyday Life – Efficiency and Sustainability
#Business Vision and Strategy #Operational Plan #Diagram
-

Startup Business Process - Efficient Operations and Strategies
#Operational Plan #Marketing Plan and Strategy #Diagram
