Segmented Bar Graph for Market & Competitor Analysis – Simple Theme
RJ0300064_28
- Last Update 05/06/2025
- File Size 0.1MB
- # of Slides 2
- File Format PPTX
- Slide Ratio 16:9
- Color
Keywords
- #Content-Based Slides
- #Design-Based Slides
- #Market and Competitor Analysis
- #Graph
- #Competitor Analysis
- #Market Analysis
- #Horizontal Bar
- #Segmented Horizontal Bar
- #16:9
- #horizontal bar chart PowerPoint
- #segmented bar graph template
- #market analysis slide
- #competitor analysis chart
- #data comparison presentation
- #multi-series bar chart download
About the Product
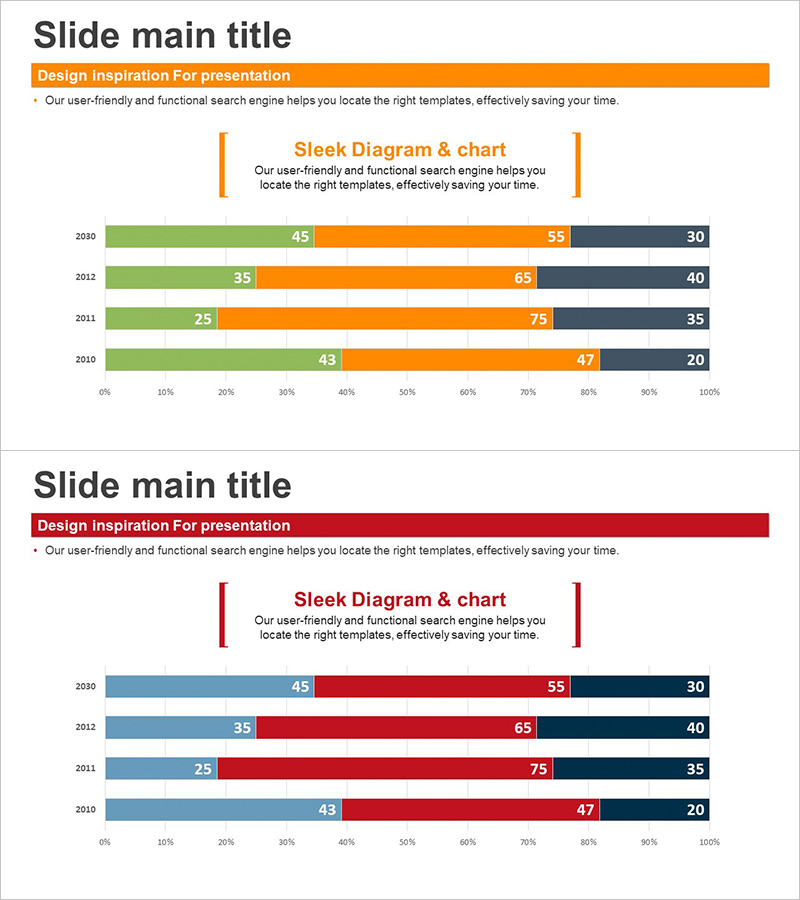
A segmented horizontal bar chart PowerPoint slide designed for market and competitor analysis presentations. This template displays data across four years (2030, 2012, 2011, 2010) with three distinct data series represented in green, orange, and gray colors. Each bar includes clear numerical labels for precise data comparison. The slide effectively communicates market share, competitive positioning, and performance trends in business presentations. Formatted in 16:9 widescreen ratio with 2 slides ready for immediate use and customization.
Usage Points
-
Main Usage
This chart excels at comparing multiple data series across time periods, making it ideal for displaying market size, competitor market share, and year-over-year performance changes. The segmented structure clearly differentiates between data series, enabling audiences to grasp complex comparative data at a glance.
-
How to Use
Integrate this slide into business plans, marketing strategy presentations, quarterly performance reports, and competitive analysis documents. Simply replace the sample data with your own figures and adjust colors as needed. Suitable for executive briefings, investor pitches, team meetings, and strategic planning sessions.
-
Recommended For
Marketing managers, business strategists, financial analysts, and executives presenting data-driven insights. Particularly valuable for competitive positioning discussions, market research presentations, performance evaluations, and strategic decision-making meetings where quantitative comparison is essential.
-
Slide Structure
2-slide template. Each slide features a title section, descriptive text box, and horizontal bar chart displaying four years of data with three color-coded series. First slide uses green, orange, and gray; second slide features blue, red, and gray color schemes for design flexibility and visual variety.
Related Products
-

Horizontal Bar Graph Broken Down by Year – Optimal for Market and Competitor Analysis
#Market and Competitor Analysis #Graph #Competitor Analysis
-

Blue Green Subdivided Graph – Template for Market and Competitor Analysis
#Market and Competitor Analysis #Graph #Competitor Analysis
-

Business Partner Analysis Bar Graph – Market Insights
#Market and Competitor Analysis #Graph #Competitor Analysis
-

Segmented Bar Graph for Market and Competitor Analysis
#Market and Competitor Analysis #Graph #Competitor Analysis
