Comparative Analysis Bar Graph – Optimal Choice for Market and Competitor Analysis
RJ0300064_14
- Last Update 05/05/2025
- File Size 0.1MB
- # of Slides 2
- File Format PPTX
- Slide Ratio 16:9
- Color
Keywords
About the Product
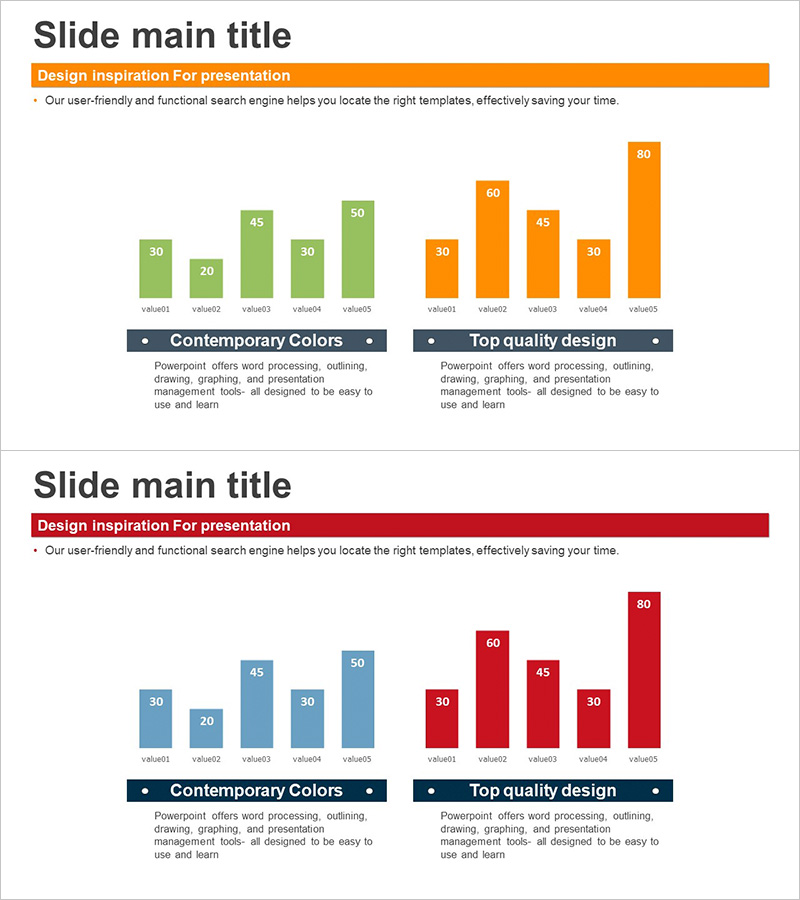
This free vertical bar graph PowerPoint slide is optimized for market analysis and competitor comparison. The slide features four color schemes (green, orange, blue, and red) to clearly compare data across five items, and you can insert it directly into your presentation by simply replacing the text and values. This PPT slide can be used in various business presentations including performance reports, business plans, and investor pitch decks for effective data visualization. Download the free PPTX format and start using it immediately without any additional cost.
Usage Points
-
Main Usage
Visualize comparative data such as market analysis, competitor benchmarking, and performance metrics in any presentation situation where clear numerical comparison is essential.
-
How to Use
Replace the five item labels and bar values with your own data to complete the slide. You can keep the color scheme or modify it as needed, and the section titles are fully editable.
-
Recommended For
Ideal for executives, marketing teams, sales teams, and finance professionals who need data-driven decision making, and suitable for business plans, performance reports, investor pitch presentations, and marketing strategy documents.
-
Slide Structure
Single-slide composition featuring a vertical bar chart format. The chart is divided into two groups: five items on the left (green tones) and five items on the right (orange and red tones), with numerical values displayed above each bar for precise data comparison.
Related Products
-

Competitive Advantage Analysis Bar Chart – Data Visualization
#Free Graphs
-

Data Visualization with Bar Charts – Presentation for Efficient Choices
#Free Graphs
-

Business Comparison Analysis Graph – Strengthening Market and Competitor Analysis
#Free Graphs
-

Vertical Bar Chart Visualizing Candidate Values – Trends and Choices
#Free Graphs
