Business Development Progress Graph – A Trendy Business Tool
RJ0300064_4
- Last Update 05/06/2025
- File Size 0.1MB
- # of Slides 2
- File Format PPTX
- Slide Ratio 16:9
- Color
Keywords
- #Content-Based Slides
- #Design-Based Slides
- #Product/Service Introduction
- #Market and Competitor Analysis
- #Graph
- #Development Status
- #Market Share
- #Circles
- #Doughnut Chart
- #16:9
- #donut chart PowerPoint slide
- #pie chart presentation template
- #ratio visualization PPT
- #circular chart slide design
- #business progress graph download
About the Product
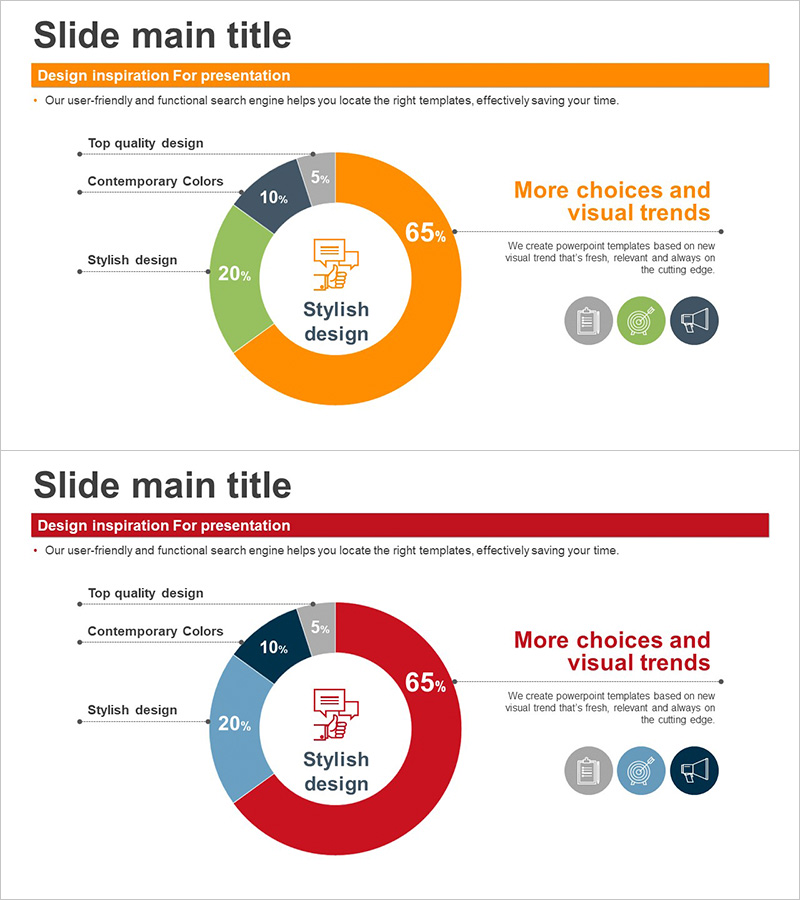
A donut chart PowerPoint slide designed to visualize business development progress and performance metrics with clarity and impact. The template features a 4-segment donut chart with a central space for key messaging or core data, making it ideal for presenting sales composition, budget allocation, customer satisfaction scores, and market analysis. Provided in orange and red color schemes, each slide is optimized for 16:9 widescreen format and fully editable. Perfect for business reports, quarterly reviews, strategic presentations, and data-driven discussions where proportional relationships need to be communicated effectively.
Usage Points
-
Main Usage
The donut chart format excels at displaying proportional relationships while maintaining visual focus through the central space. The 4-segment structure allows clear differentiation of data categories, and the color-coded sections enable quick audience comprehension. Ideal for presenting sales channel breakdown, departmental budget allocation, customer segment distribution, market share analysis, and project completion rates.
-
How to Use
Double-click the chart data to input your own values; the visualization updates automatically. Modify segment colors through the Design tab to match your brand guidelines. Edit legend labels and descriptive text to align with your presentation narrative. The template supports both orange and red color palettes, with flexibility to apply custom color schemes as needed.
-
Recommended For
Marketing managers, sales directors, project leads, financial analysts, and executive presenters. Suitable for quarterly business reviews, sales performance reports, budget allocation presentations, customer satisfaction surveys, market analysis briefings, and any data-driven discussion requiring clear ratio visualization.
-
Slide Structure
2-slide layout. Slide 1: Orange-toned donut chart (4 segments with central icon), legend and descriptive text on the right. Slide 2: Red-toned donut chart (matching structure), additional insight text area on the right. Clear visual hierarchy with distinct title, chart, and text zones for professional information delivery.
Related Products
-

City Theme Market Share Graph – Business Data Visualization
#Product/Service Introduction #Market and Competitor Analysis #Graph
-

Doughnut Chart Visualizing Current Status of 3D Printing Technology Development
#Product/Service Introduction #Market and Competitor Analysis #Graph
-

Graph of Analysis of Transportation Development Status
#Product/Service Introduction #Market and Competitor Analysis #Graph
-

Analysis graph of market share progress
#Product/Service Introduction #Market and Competitor Analysis #Graph
