Composition Content Bar Graph – Information Delivery and Analysis
RJ0300064_5
- Last Update 05/06/2025
- File Size 0.2MB
- # of Slides 2
- File Format PPTX
- Slide Ratio 16:9
- Color
Keywords
- #Content-Based Slides
- #Design-Based Slides
- #Product/Service Introduction
- #Business Introduction
- #Graph
- #Composition
- #Technological Status
- #Horizontal Bar
- #Segmented Horizontal Bar
- #16:9
- #horizontal bar graph PowerPoint
- #bar chart slide template
- #data visualization PPT
- #composition comparison chart
- #information delivery slide
About the Product
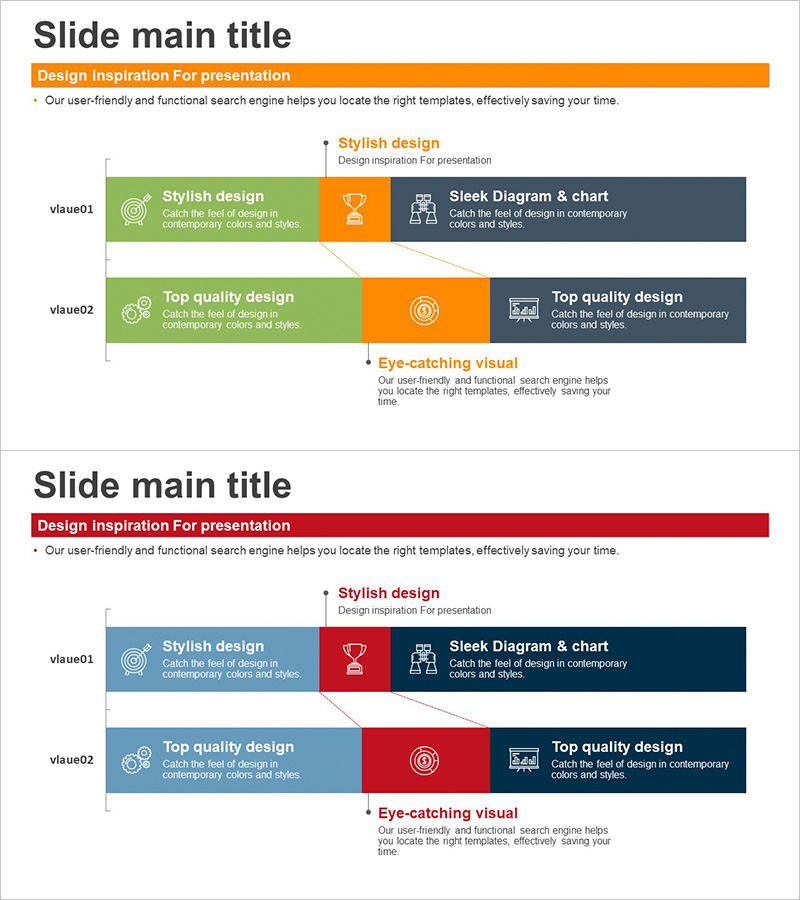
A 2-slide horizontal bar graph PowerPoint presentation template designed for clear data visualization and comparative analysis. The slides feature a green and gray dual-tone color scheme with strategically placed icons and text areas to highlight information delivery. This PowerPoint slide deck is ideal for business introductions, technology overviews, product composition explanations, and data-driven presentations. The 16:9 widescreen format ensures compatibility with modern displays, and the PPTX format allows seamless editing across all PowerPoint versions. Each slide provides dedicated space for bar graph visualization with accompanying descriptive text.
Usage Points
-
Main Usage
Effectively visualize business introductions, technology status, product composition, and multi-stage information using horizontal bar graphs. The layout enables audiences to quickly compare item sizes and proportions, making it ideal for data-driven executive presentations and strategic decision-making discussions.
-
How to Use
Utilize the 2 slides sequentially—first slide for primary components, second for detailed information. Replace placeholder text with company names, product details, and numerical data. Adjust bar lengths to match actual data values and customize colors to align with your corporate branding guidelines.
-
Recommended For
Recommended for business planning, marketing strategy presentations, technology introductions, financial reports, and organizational structure explanations. Ideal for executive briefings, investor pitch decks, and product launch presentations. Suitable for consulting firms, IT companies, manufacturing enterprises, and management teams requiring professional data visualization.
-
Slide Structure
2-slide layout with each slide divided into three sections: left green background with icon and text, center orange accent area, and right gray information panel. Each slide contains 2 horizontal bar graph areas enabling comparison of up to 4 data items. Consistent layout across both slides ensures cohesive visual storytelling and professional presentation flow.
Related Products
-

Business Technology Status Bar Graph – Insights Delivered Through Data Visualization
#Product/Service Introduction #Business Introduction #Graph
-

Business Sector Analysis Chart – Multifaceted Visualization
#Business Introduction #Market and Competitor Analysis #Diagram
-

Horizontal Bar Chart Slide Highlighting Fintech Service Composition
#Product/Service Introduction #Technical Approach #Graph
-

Data Analysis Segmented Bar Graph – Technology Status and Analysis
#Product/Service Introduction #Business Introduction #Graph
