Grid PowerPoint Template – Stylish Design
J0200023
- Last Update 01/04/2025
- File Size 19.6MB
- # of Slides 35
- File Format PPTX
- Slide Ratio 16:9
- Color
Slide Preview


Keywords
About the Product
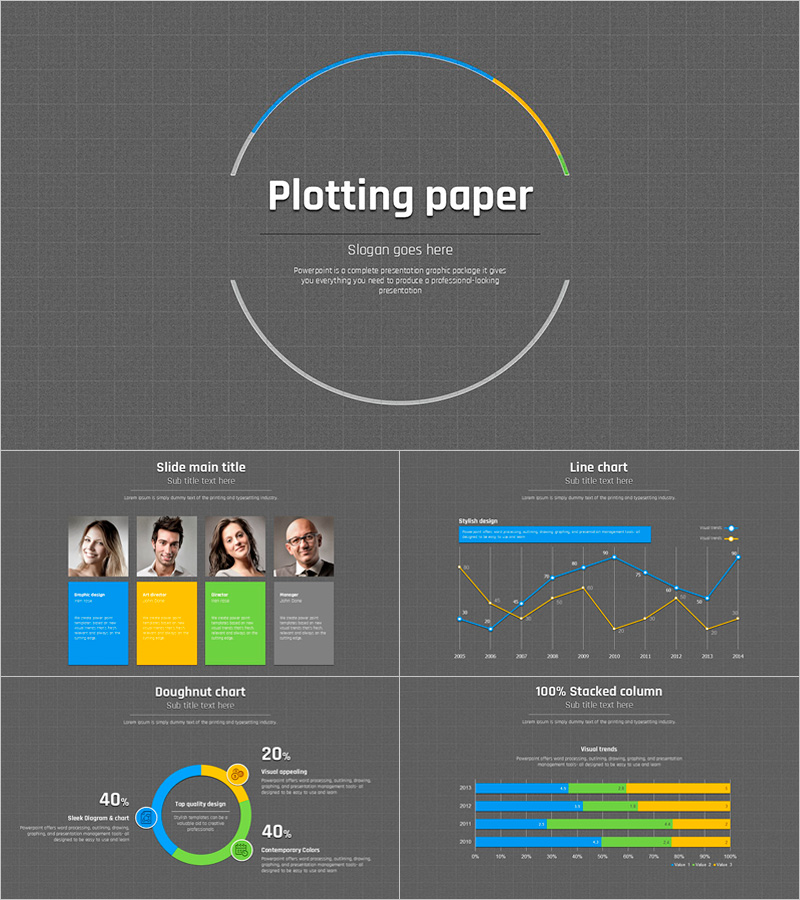
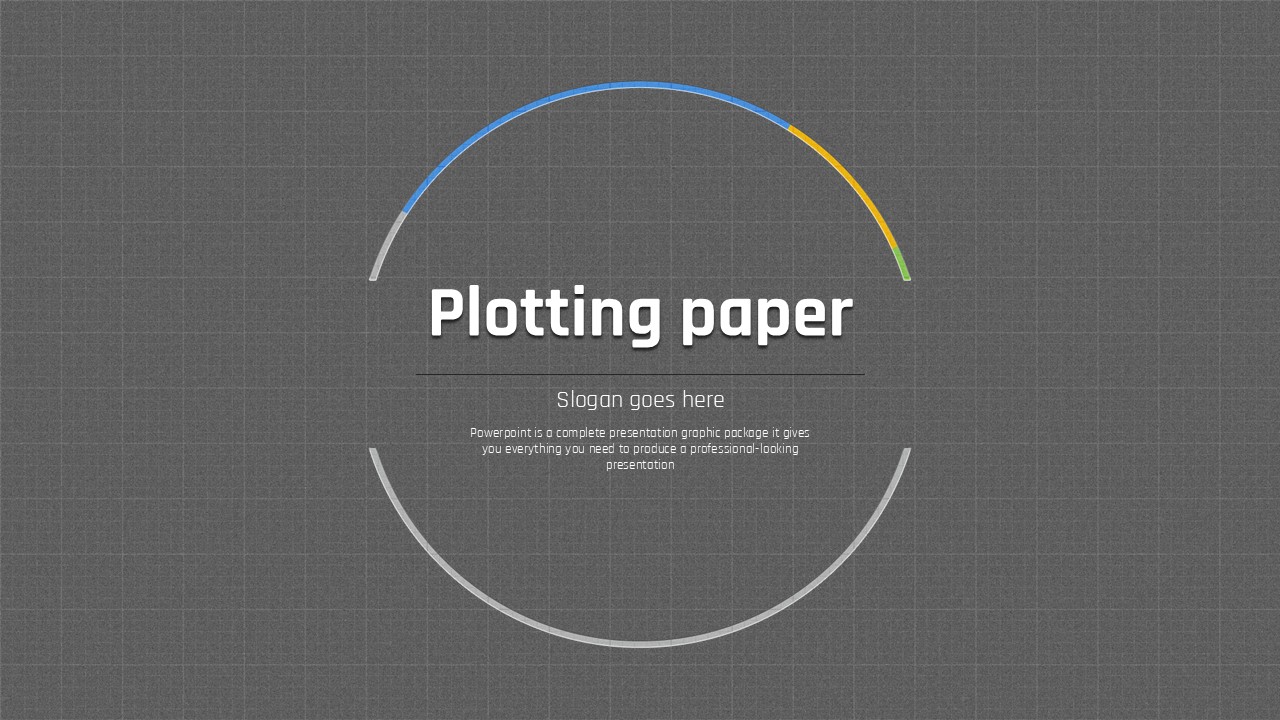
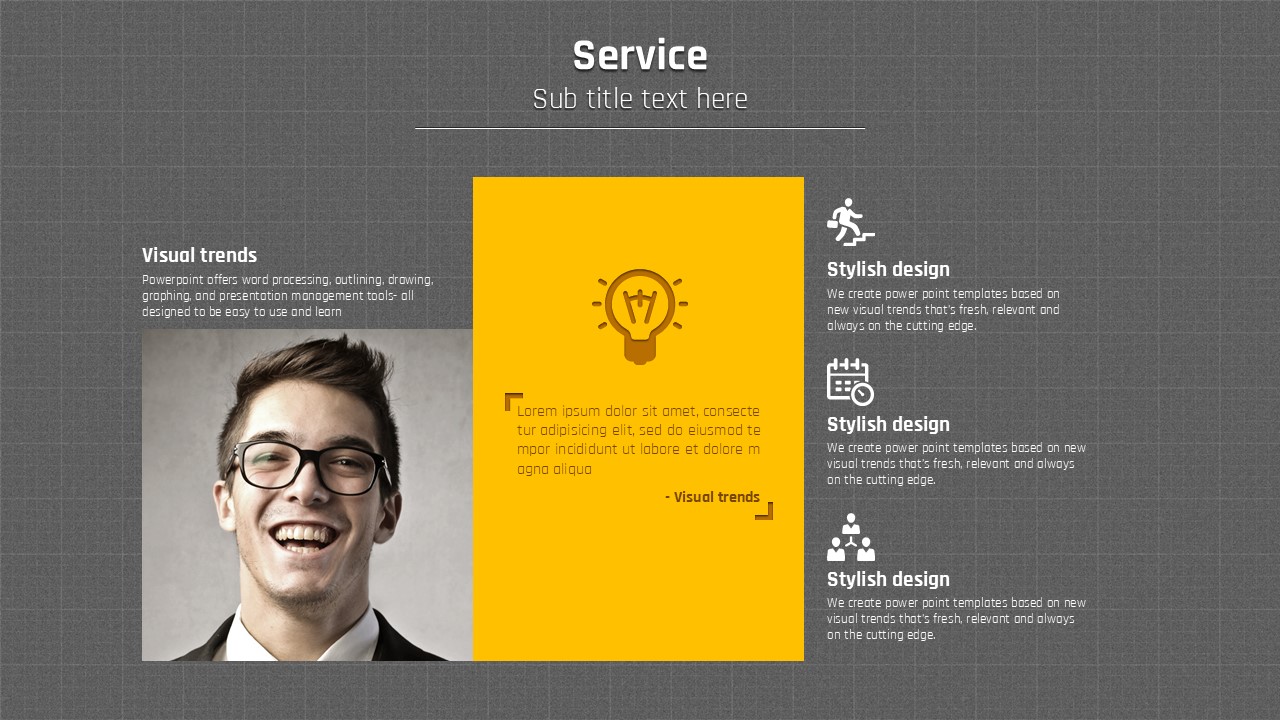
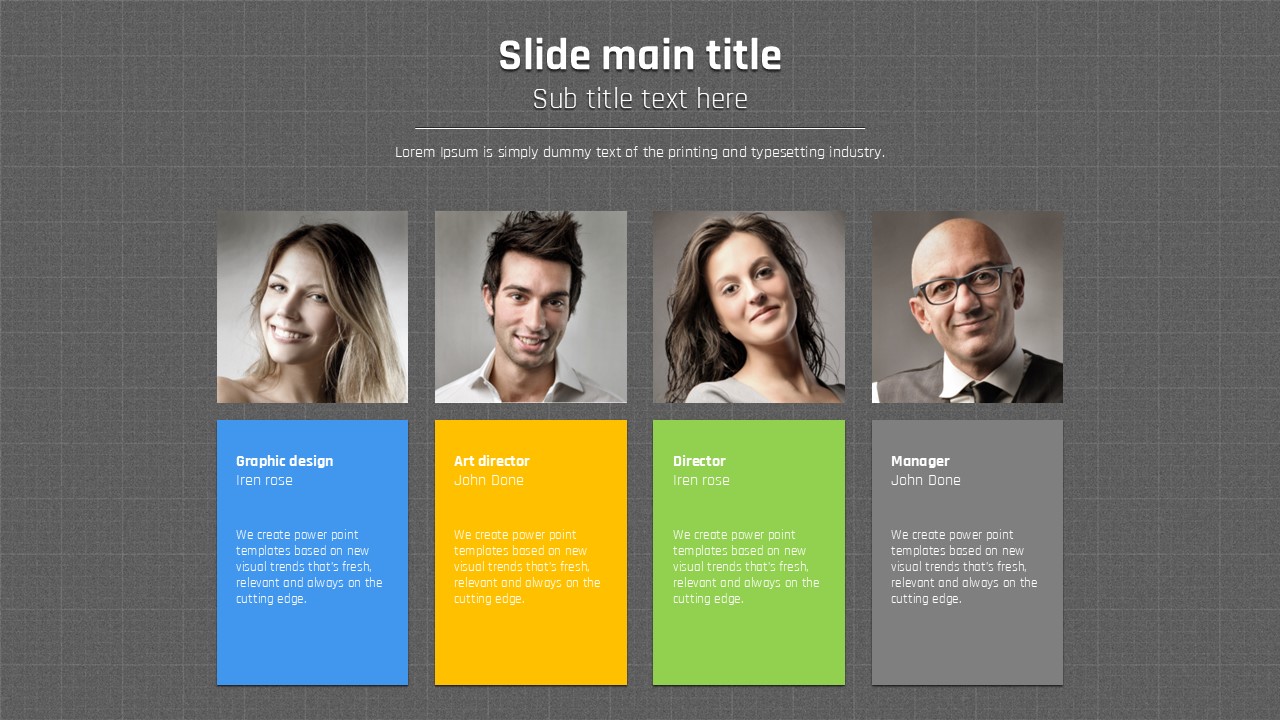
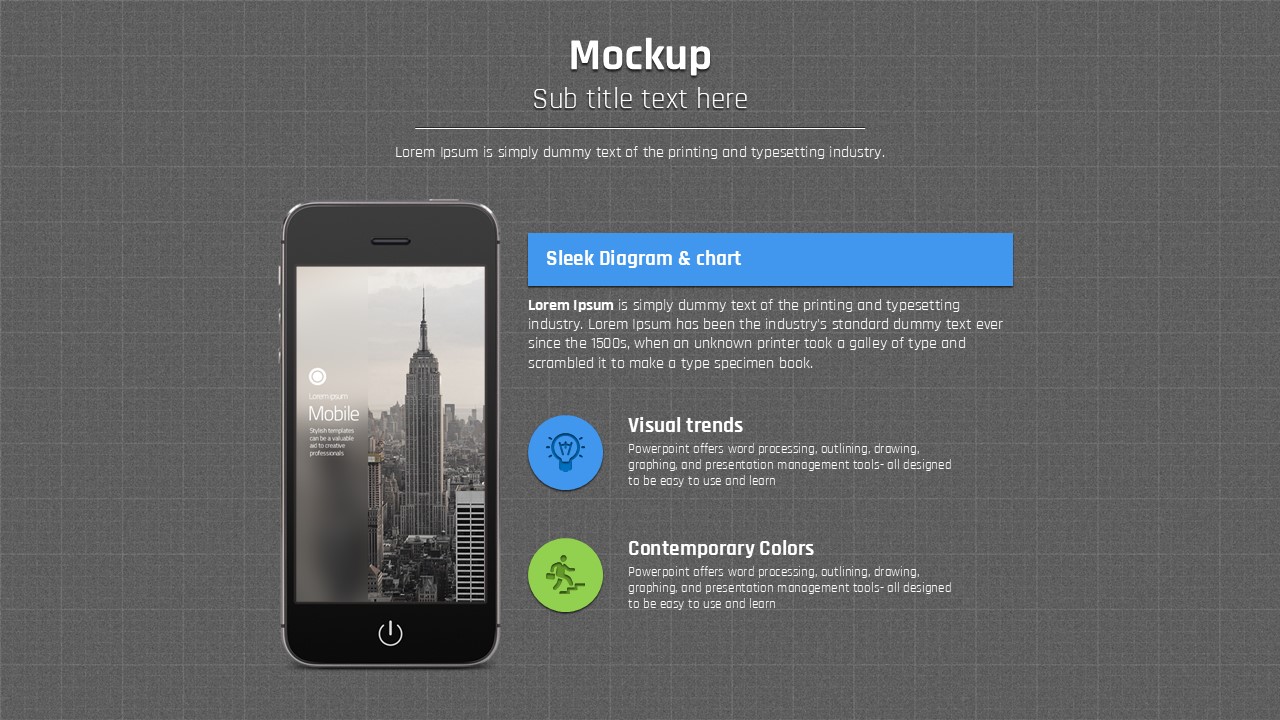
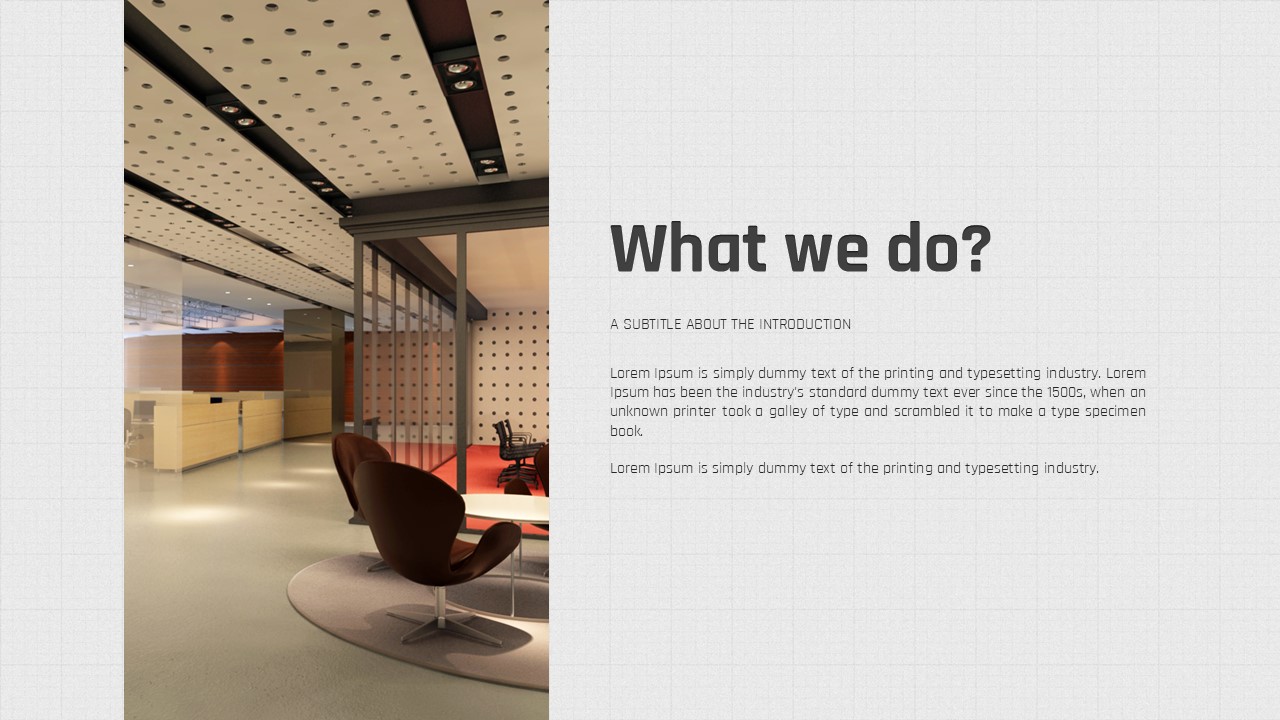
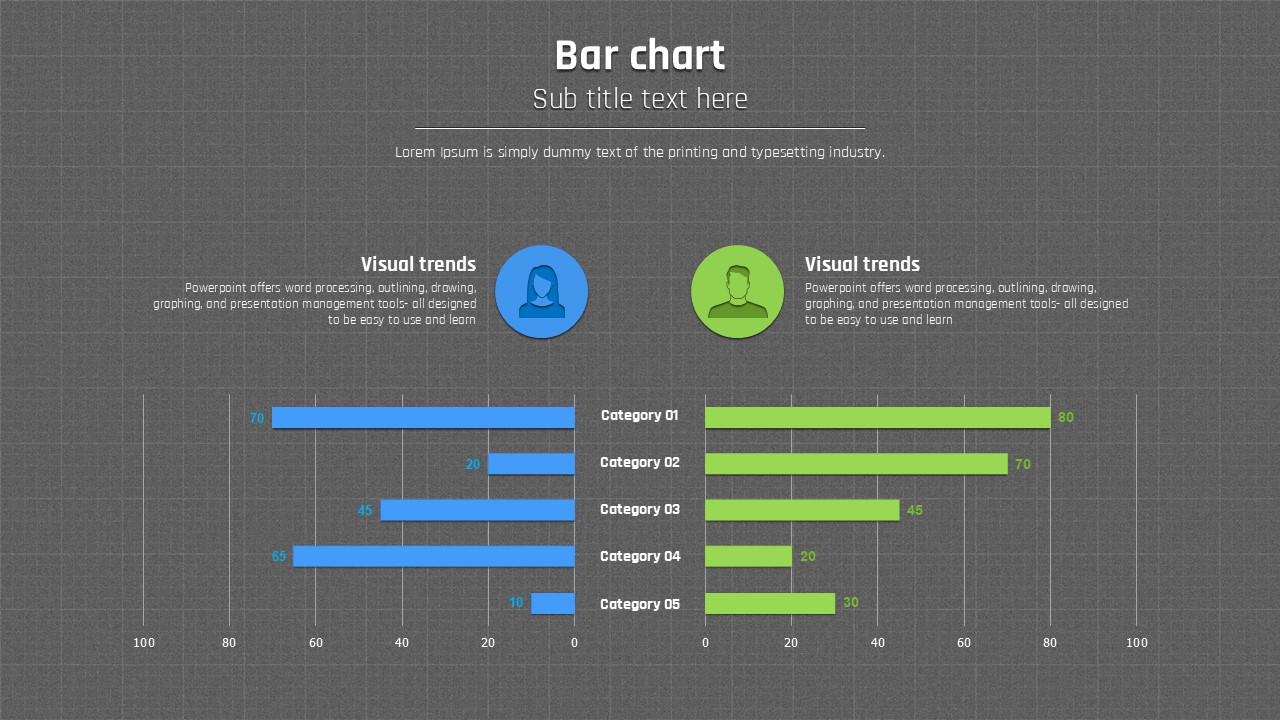
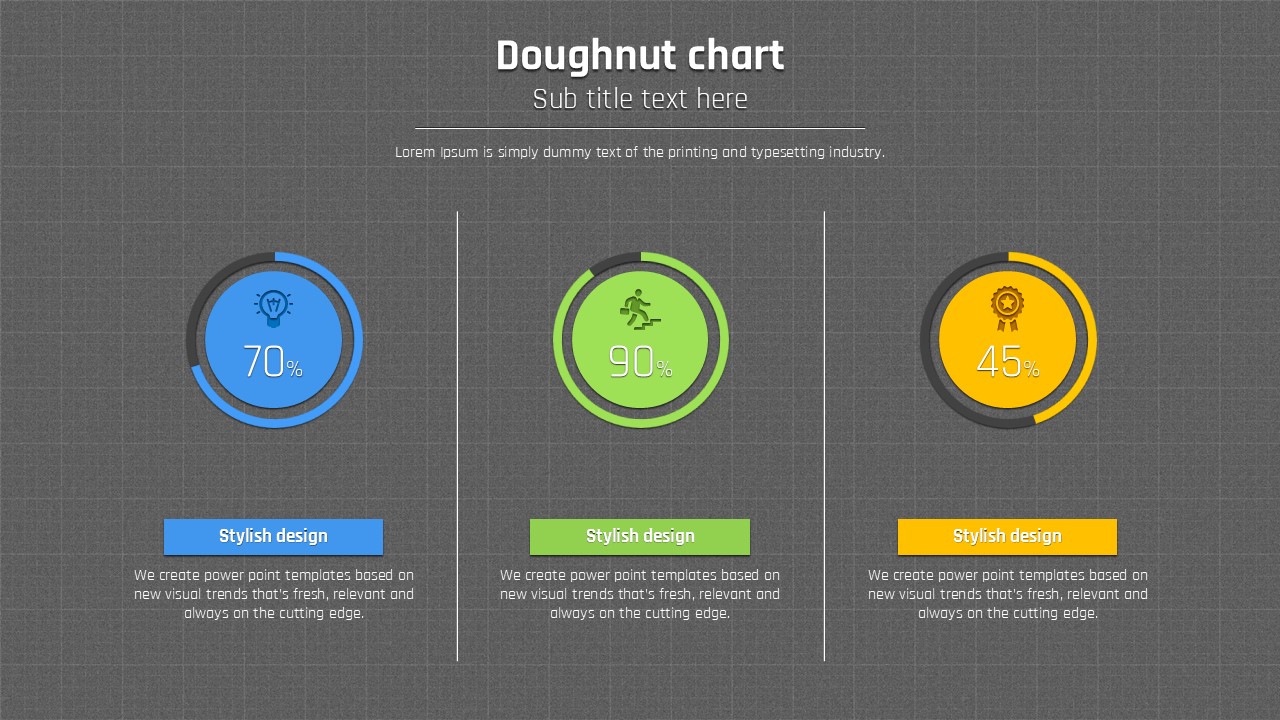
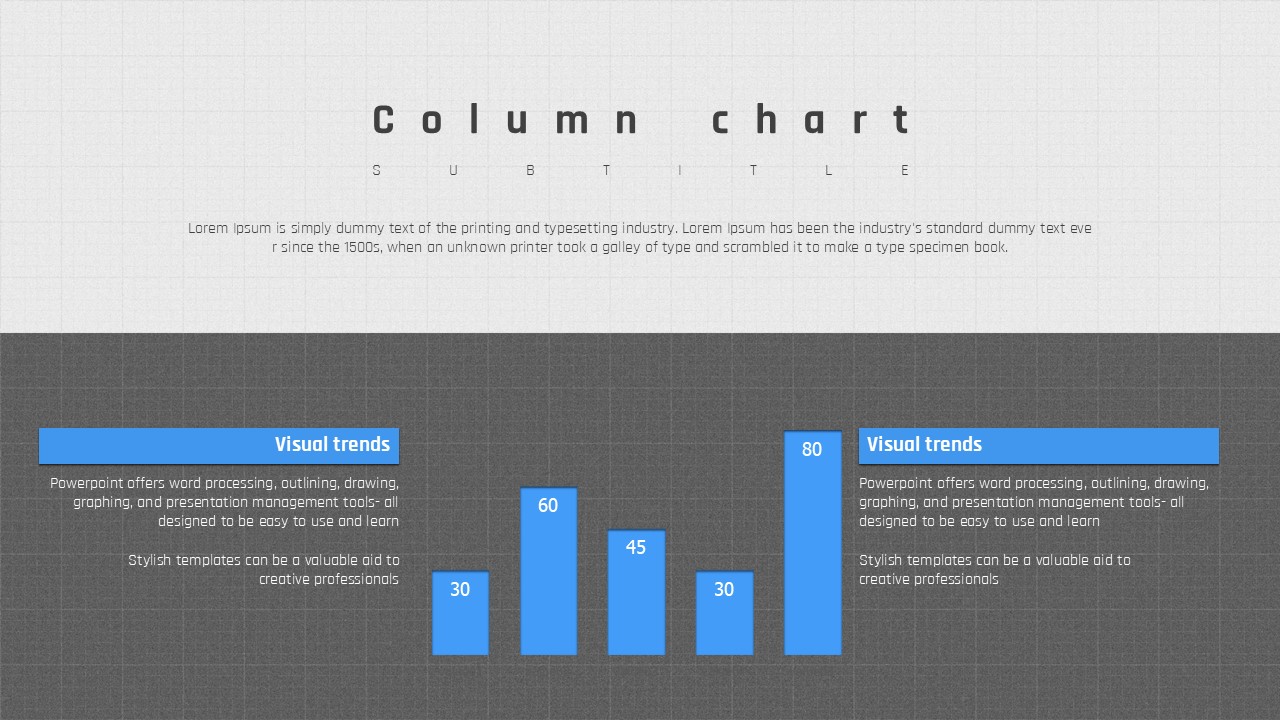
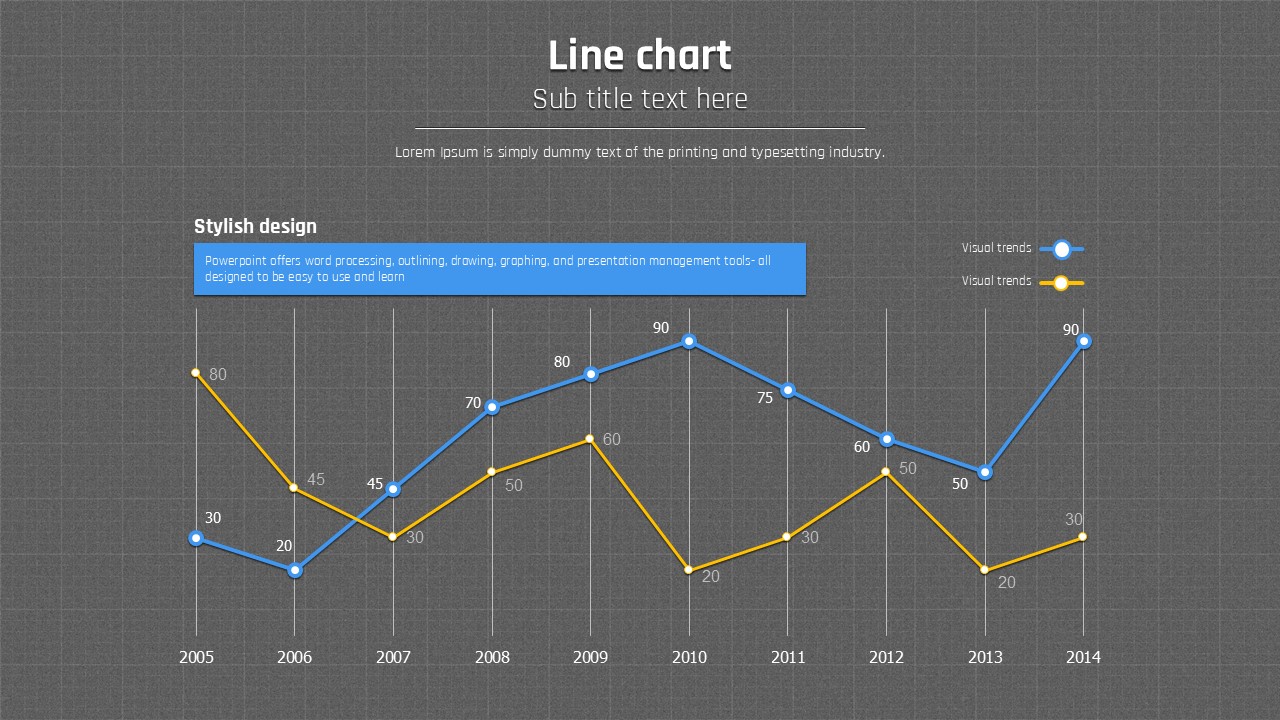
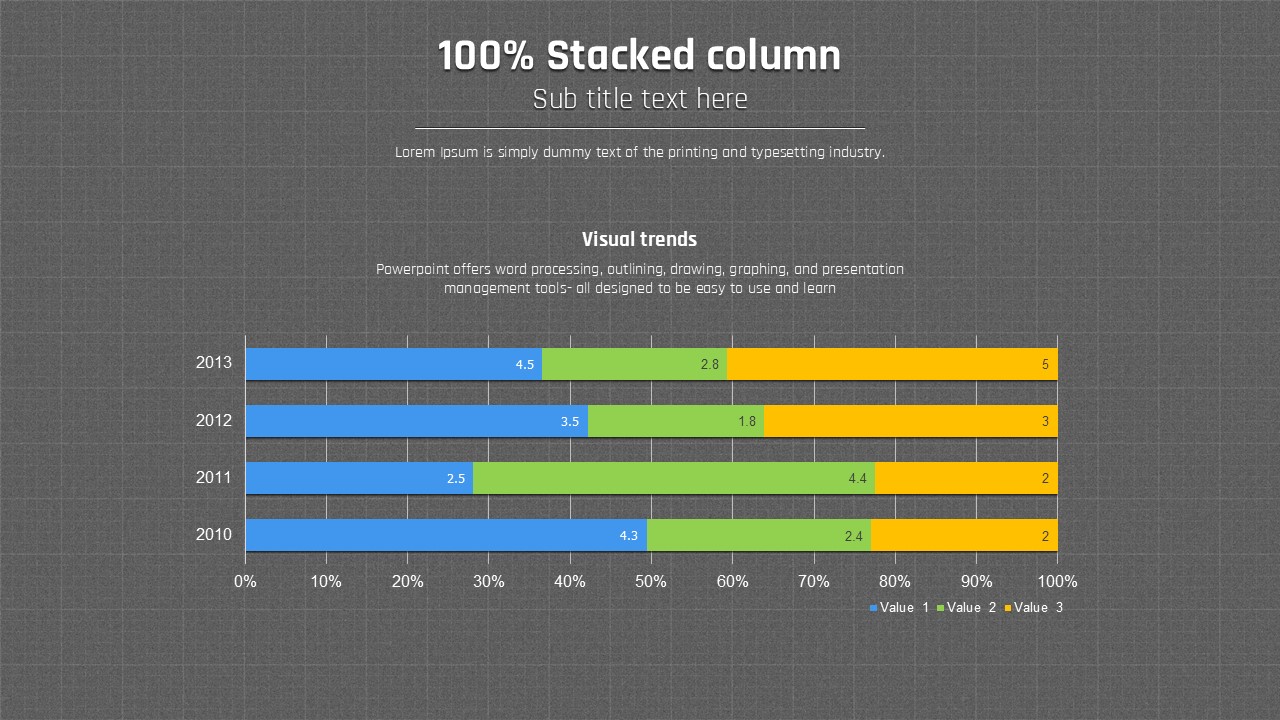
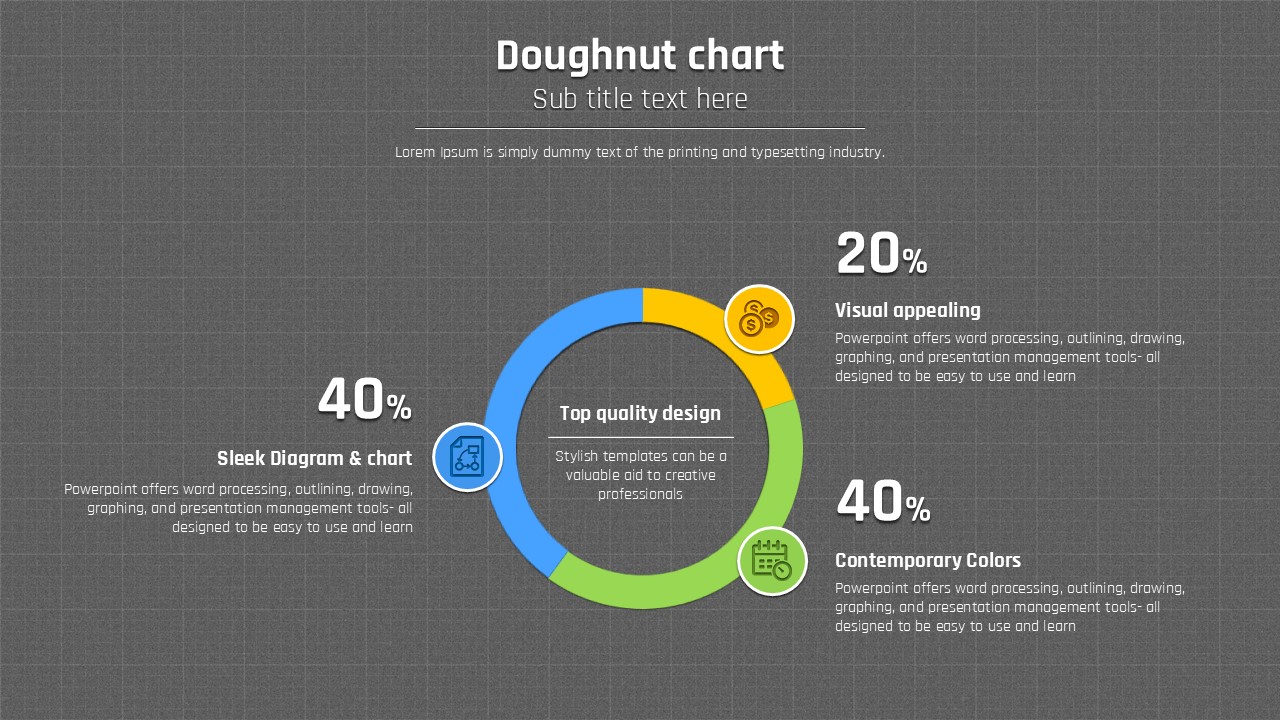
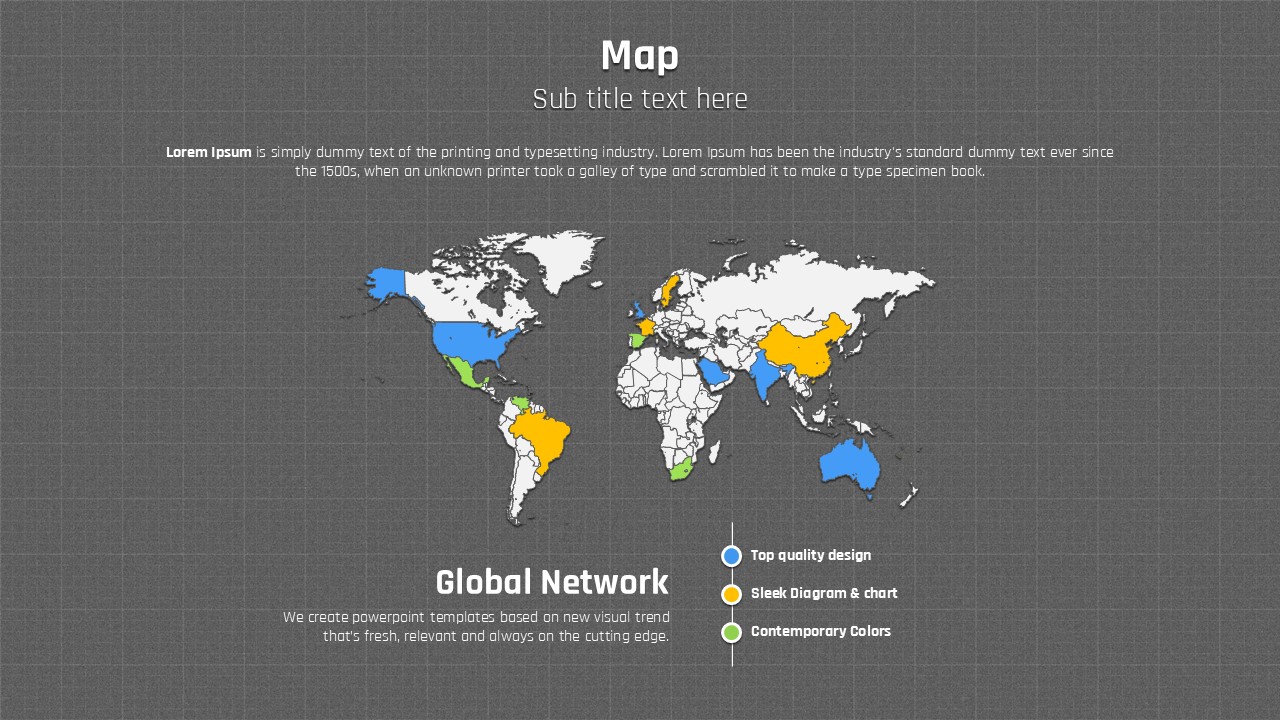
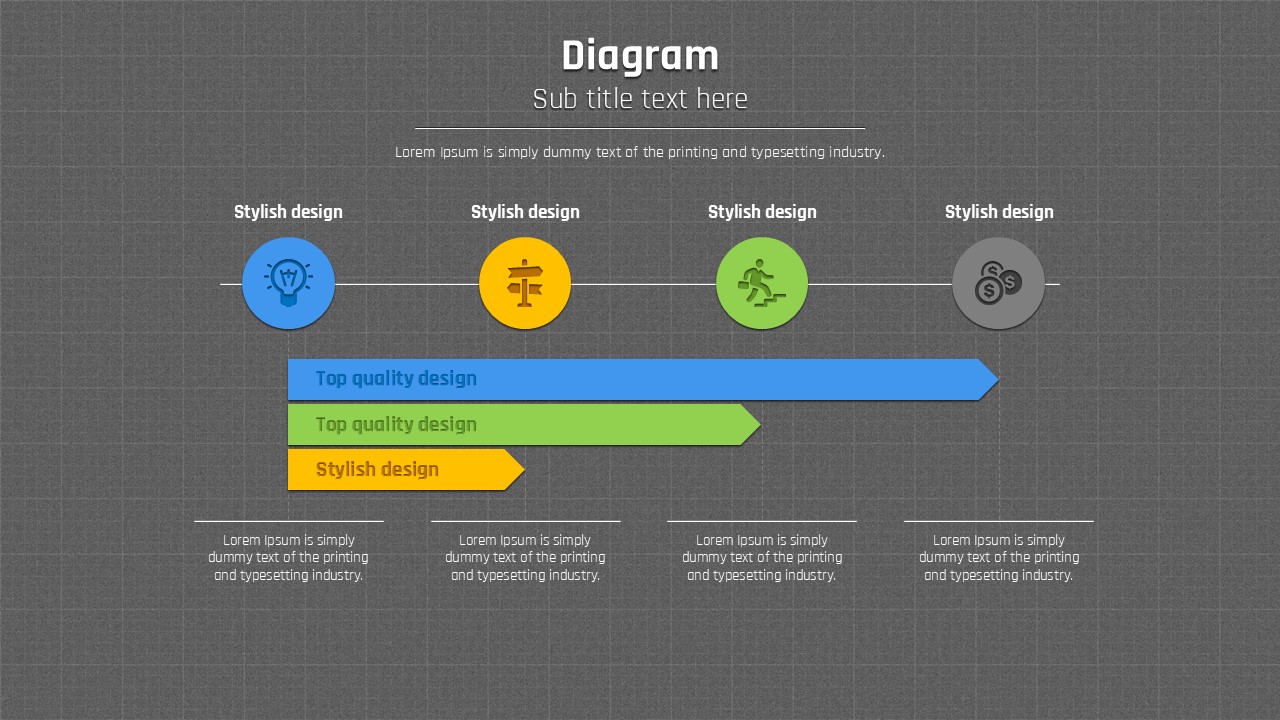
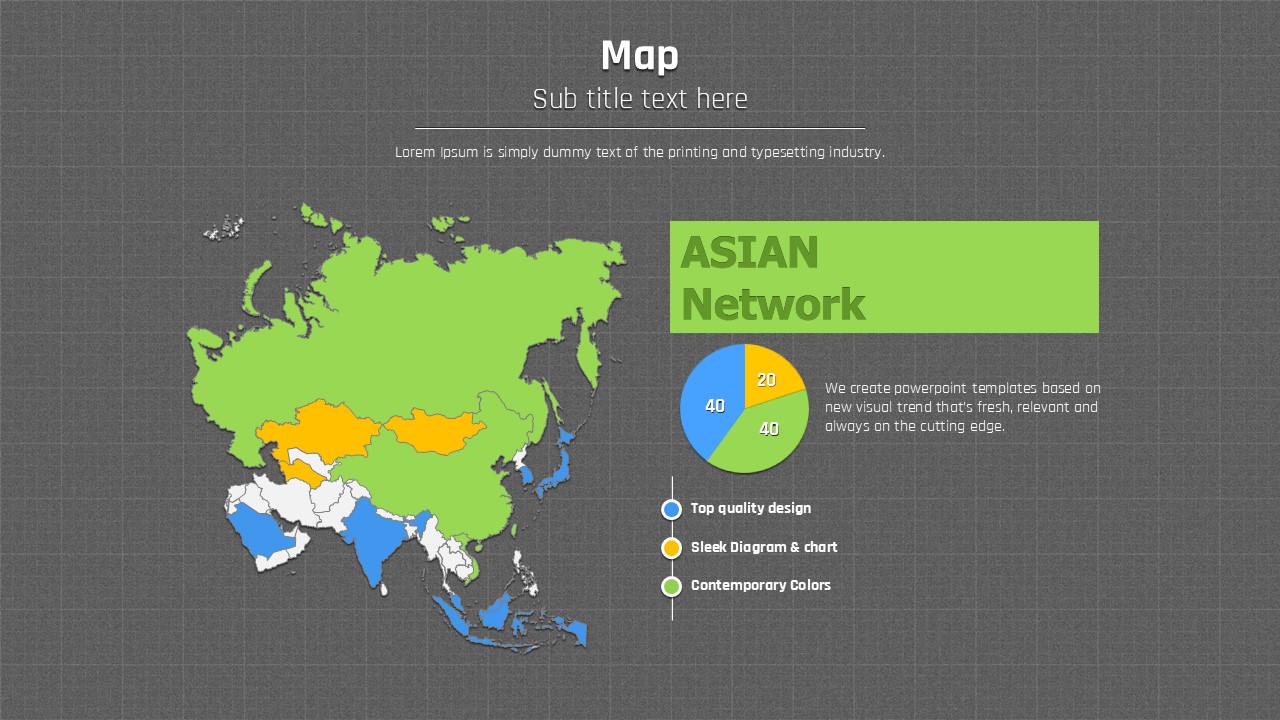
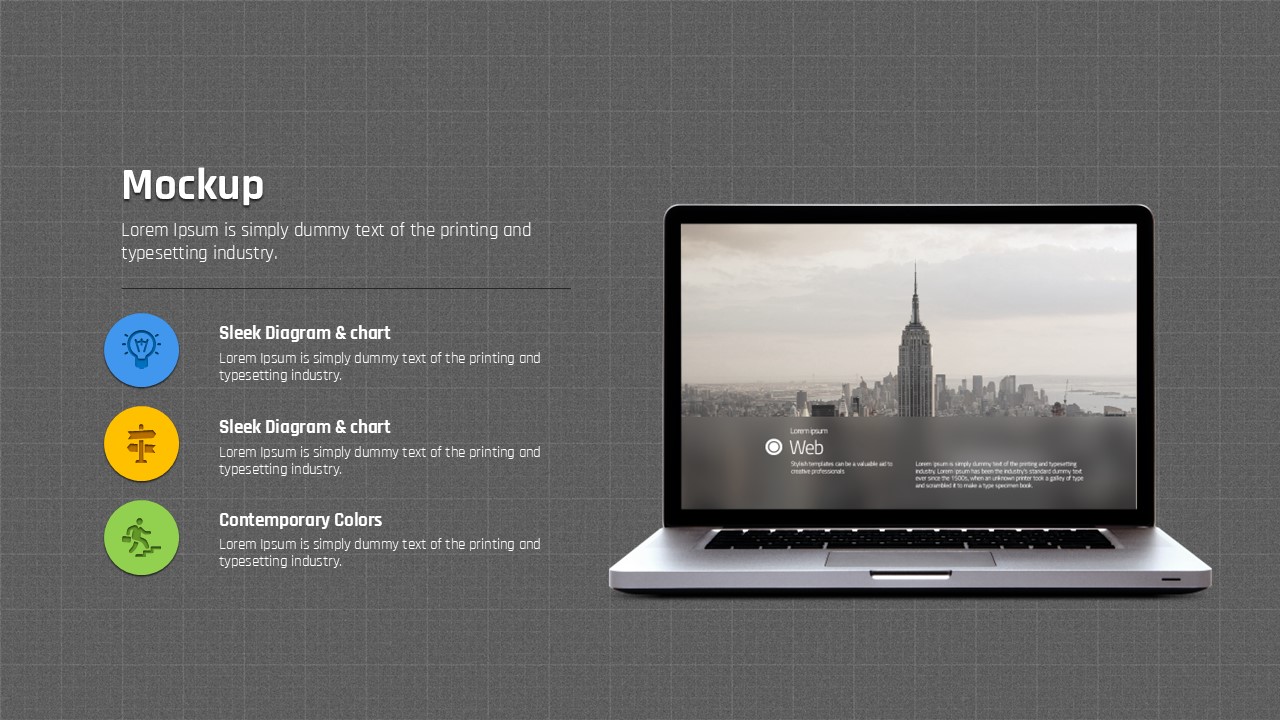
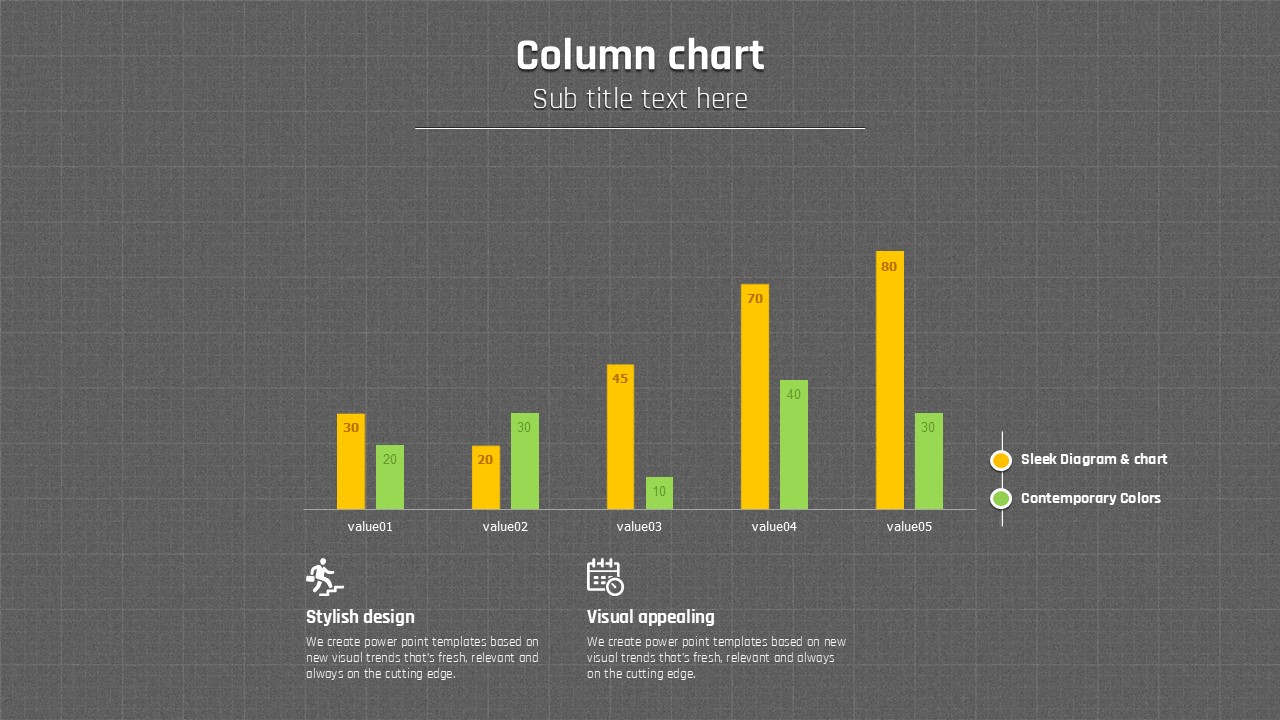
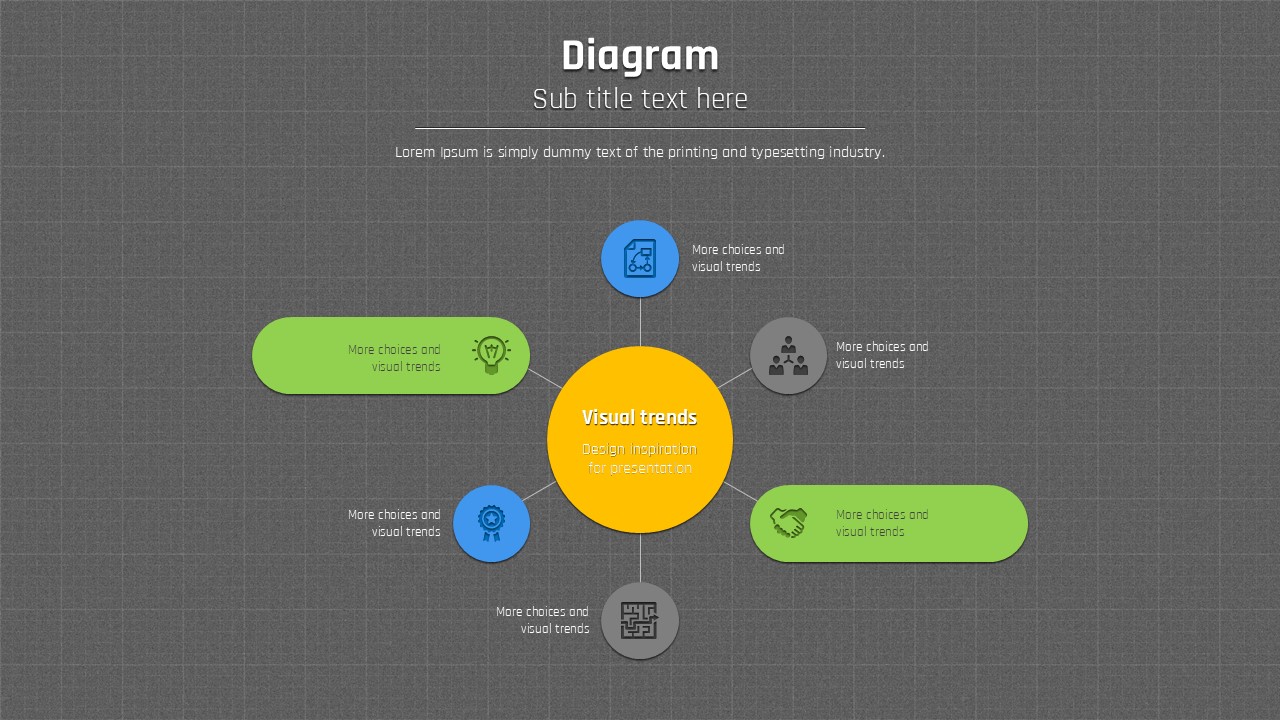
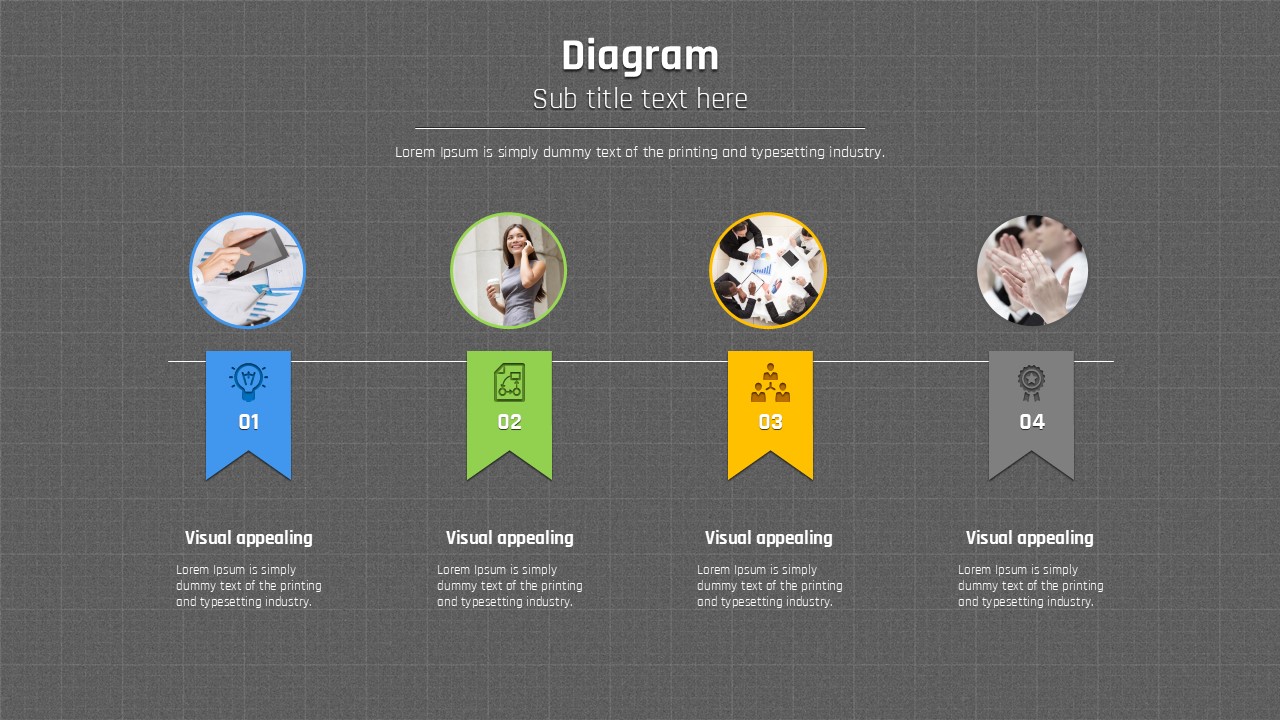
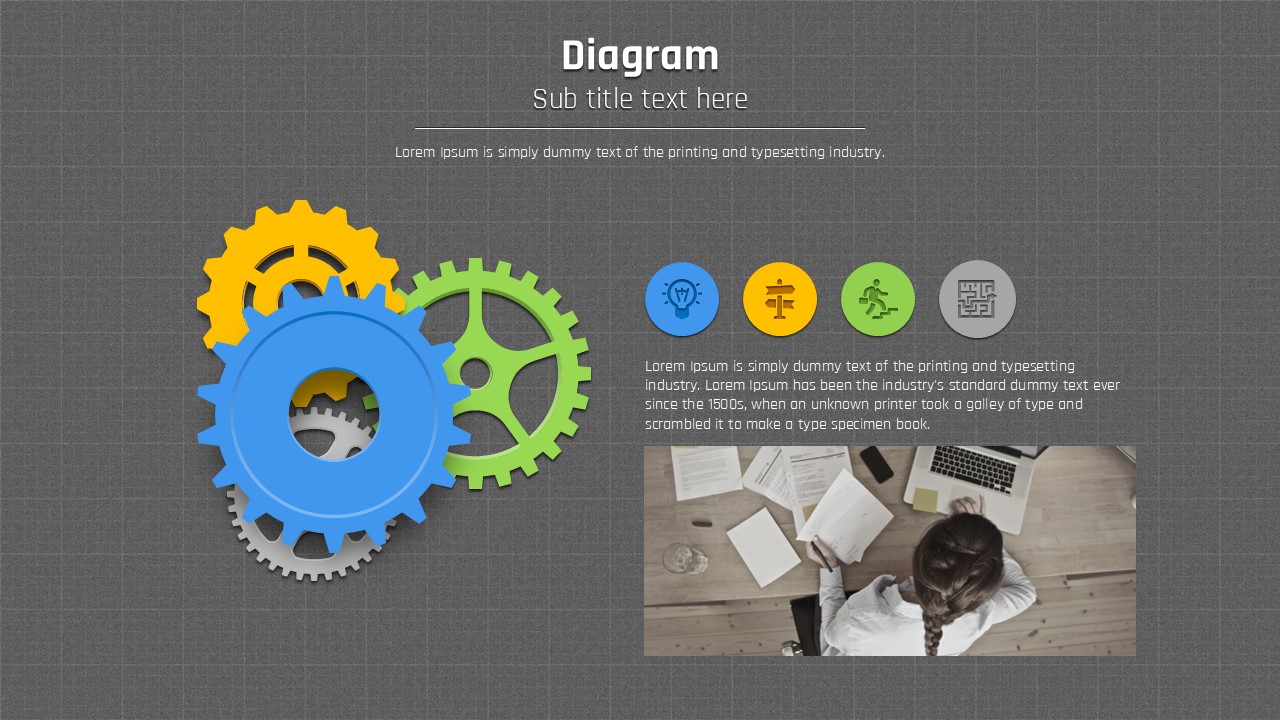
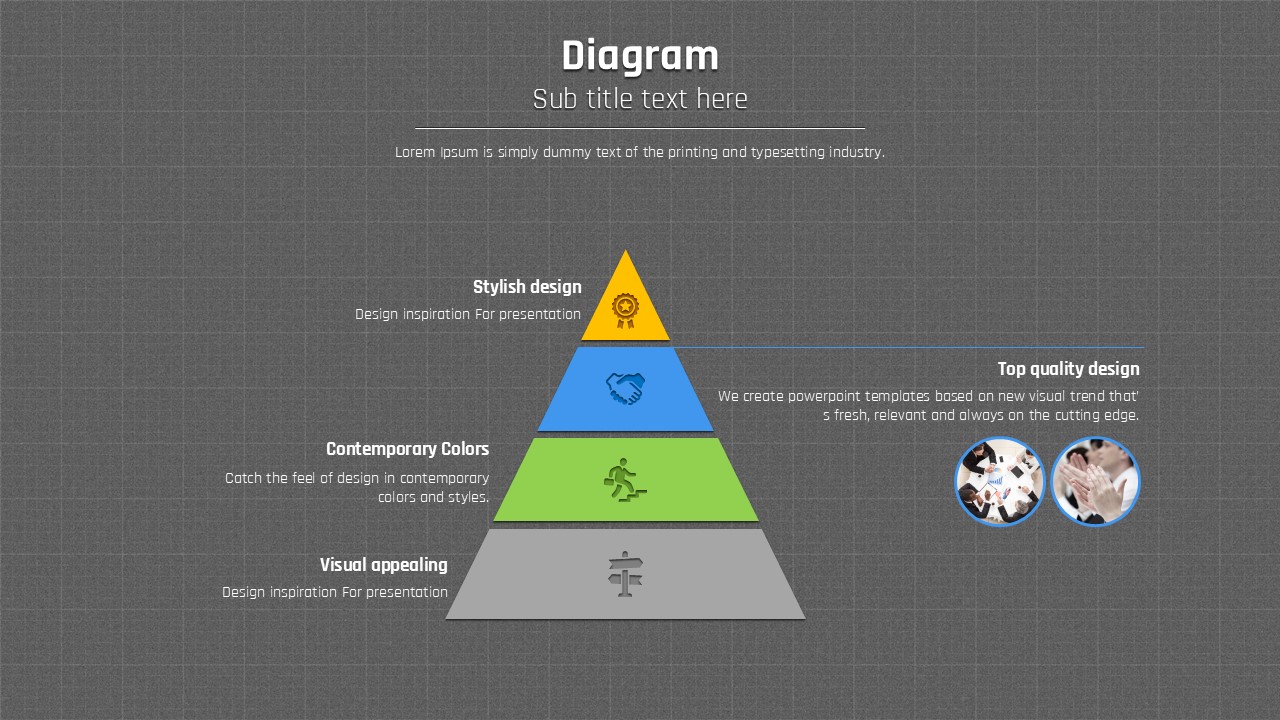
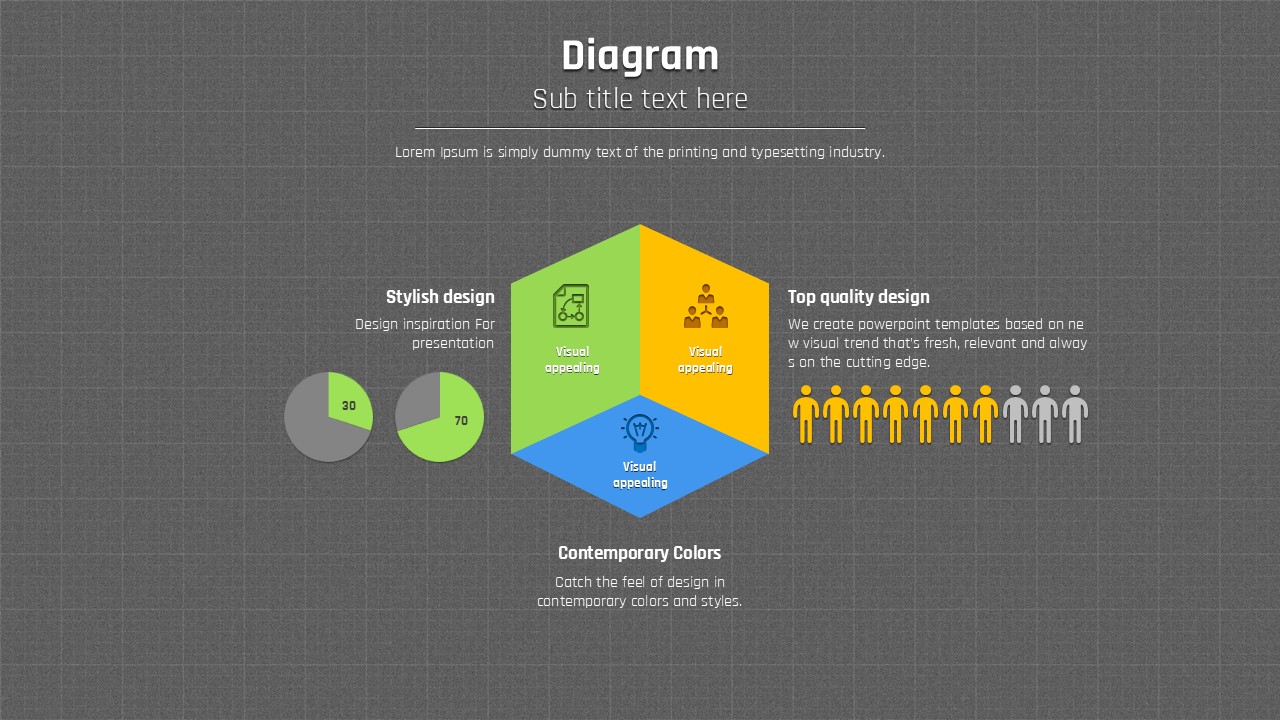
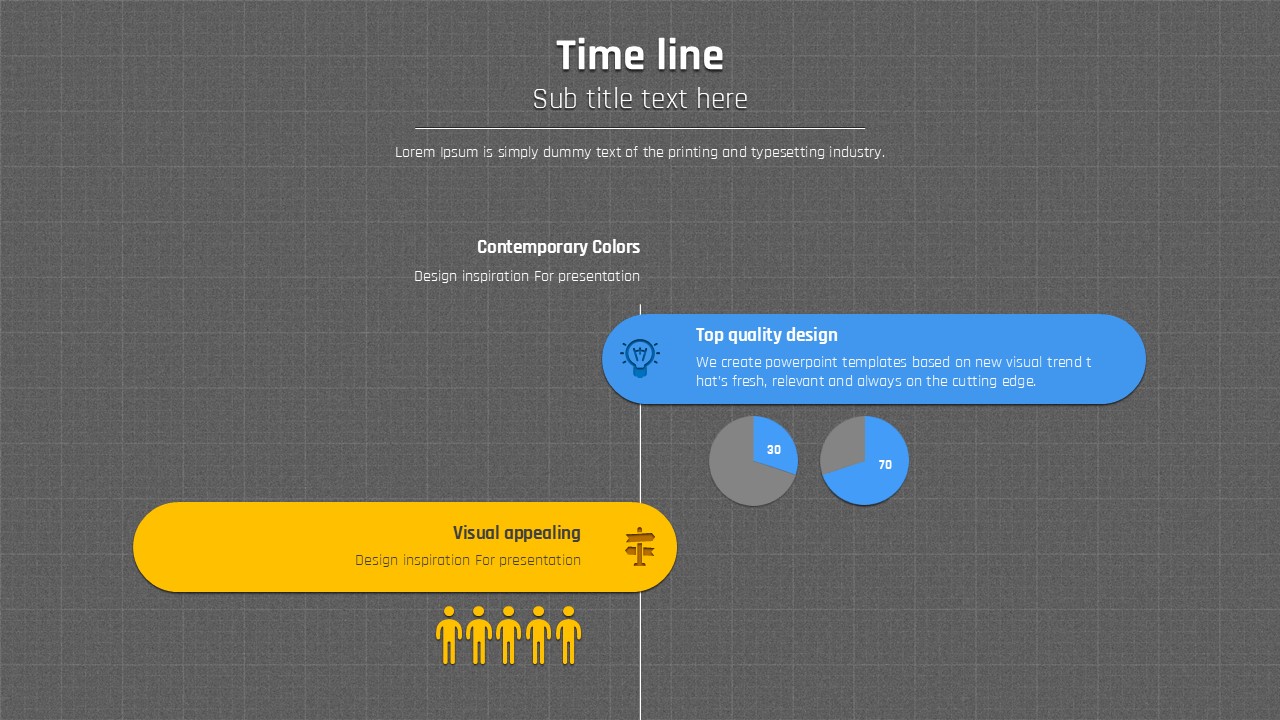
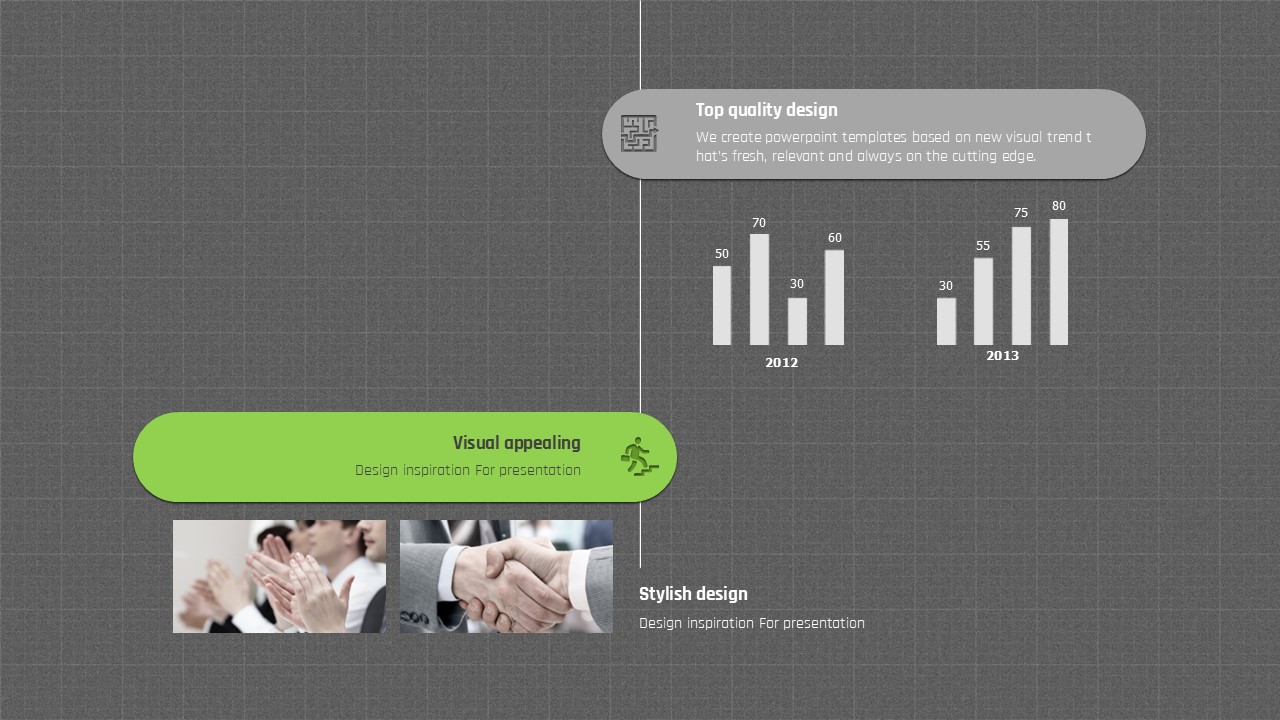
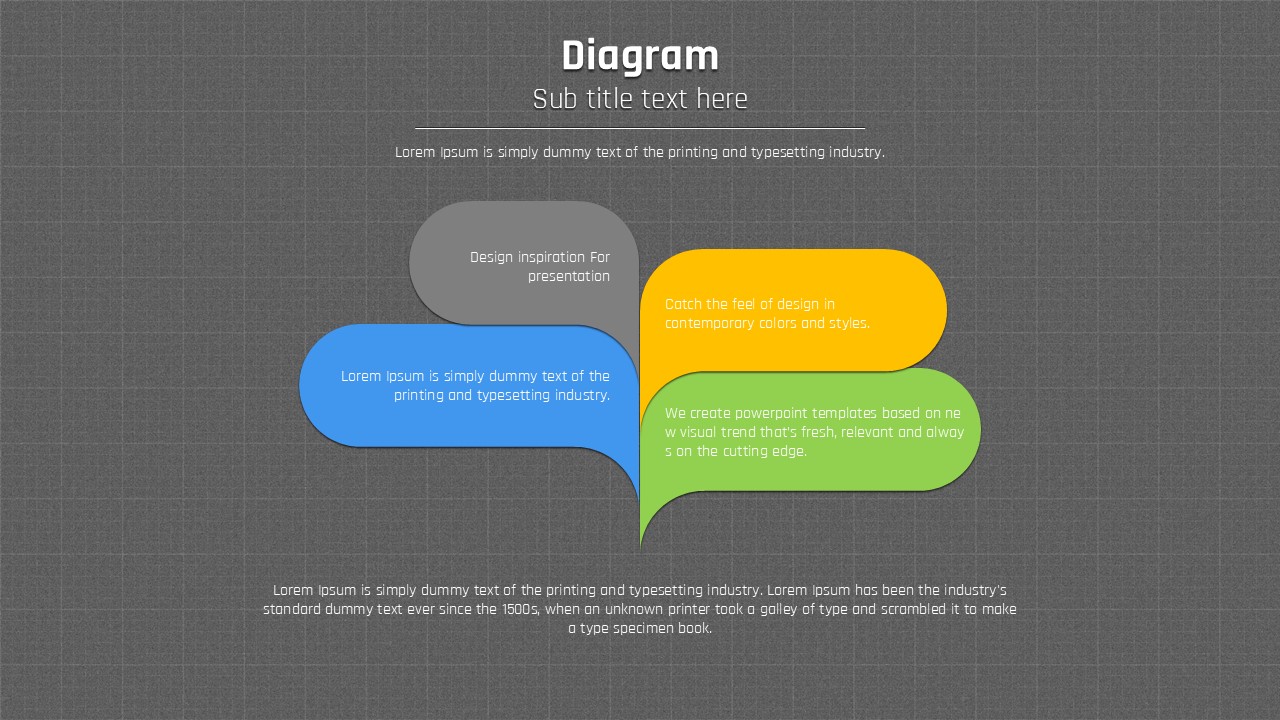
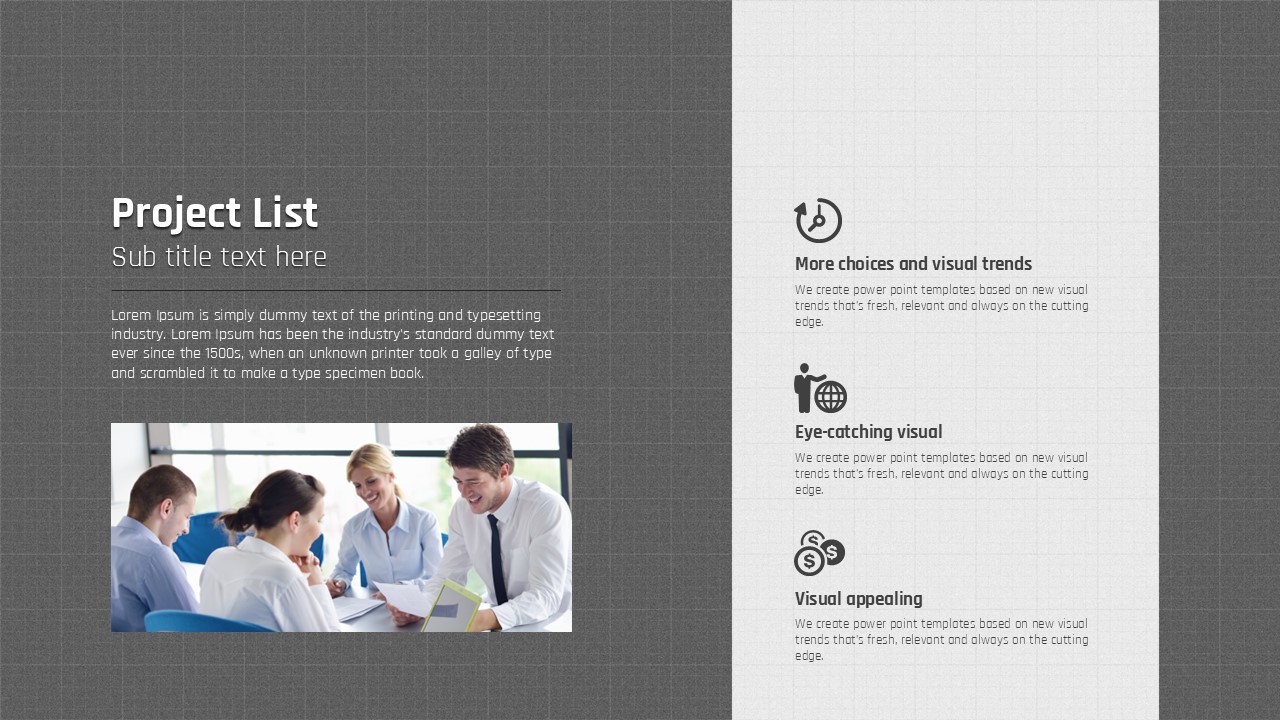
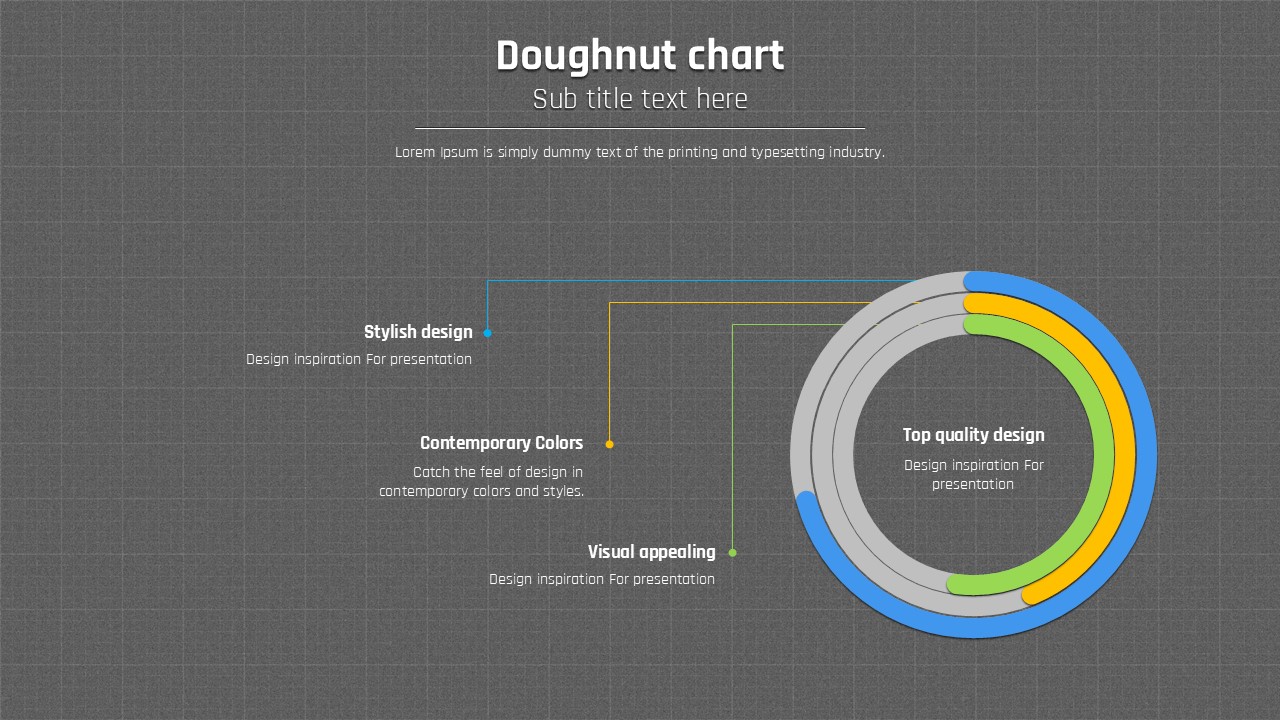
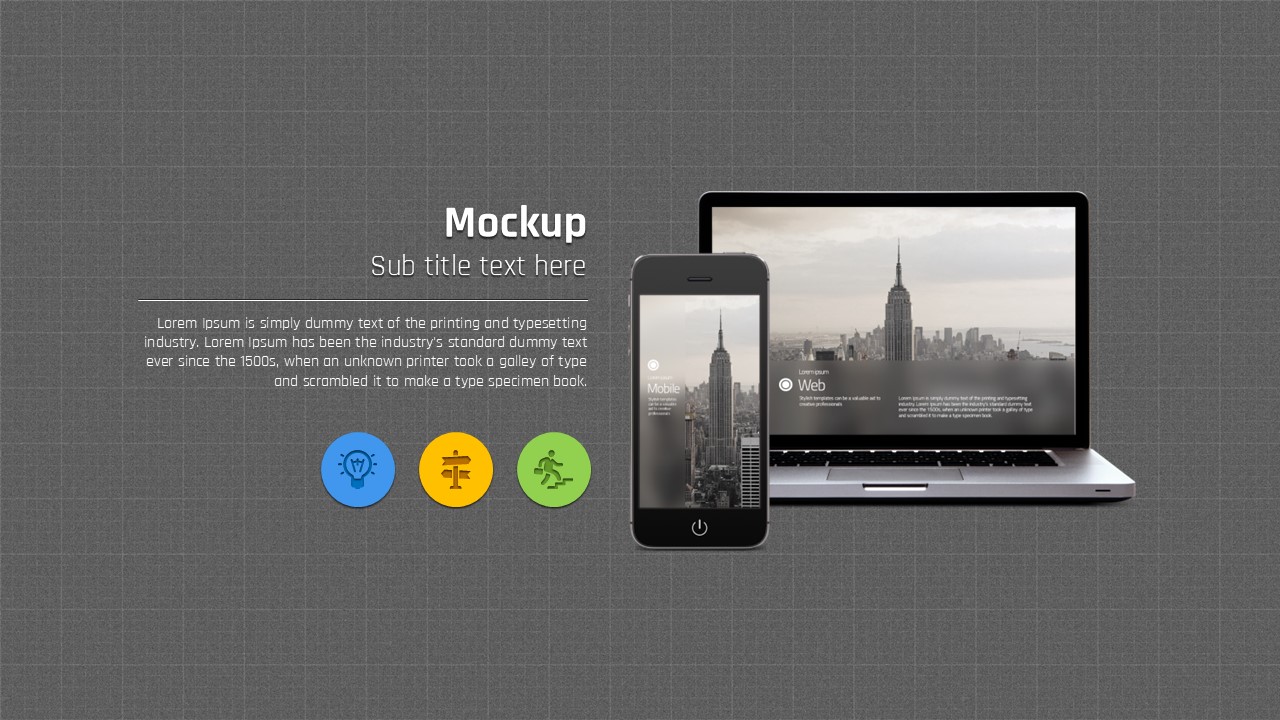
This business PowerPoint template features a dark gray grid (graph paper) background paired with blue, gold, and green accent colors for a modern, data-driven aesthetic. The 35-slide set includes a wide variety of data visualization slides — line charts, donut charts, column charts, and 100% stacked bar charts — making it ideal for presenting numerical insights and business trends. Additional slides cover team introductions with photo card layouts, title slides with circular arc graphics, and structured content pages. All slides are provided in fully editable PPTX format, allowing you to replace text, update chart data, and adjust colors to match your brand. The 16:9 widescreen ratio ensures crisp display on large presentation screens. Whether you're preparing a quarterly report, market analysis, or strategic planning deck, this template gives you a professional, consistent visual framework to work from.
Usage Points
-
Main Usage
Designed for business professionals who need to present data, trends, and performance metrics clearly. The template's built-in chart slides — line, donut, column, and stacked bar — let you visualize complex numbers without building layouts from scratch, saving time on quarterly reports, market analyses, and strategy decks.
-
How to Use
Open the PPTX file and replace placeholder text and chart data with your actual figures. The blue, gold, and green accent colors can be adjusted to match your brand palette via PowerPoint's theme color settings. Swap team member photos on the introduction slide, update the title and slogan on the cover, and your presentation is ready to deliver.
-
Recommended For
Best suited for business analysts, strategy consultants, financial planners, and IT professionals who regularly present data to executives or investors. The dark grid aesthetic aligns well with tech, consulting, and finance industries where a precise, data-forward visual tone is expected.
-
Slide Structure
35 slides total: circular arc graphic cover slide, 4-person team introduction with color card layout, dual-series line chart (blue and gold trend lines, 2005–2014), donut chart with percentage callouts and icon cards, column chart with split light/dark background layout, and 100% stacked horizontal bar chart for year-over-year comparison.
Related Products
-

Rhombus Template Wide – Sophisticated Design for Information Delivery
#General
-

Simple Circle PowerPoint Template – Striking and Stylish Design
#General
-

Five Color Powerpoint Template Wide – Visually Striking Design
#General
-

Hexagon Pattern Wide Presentation Template – Modern and Elegant Design
#General
