Plotting Paper Presentation Template Column Chart – Business Strategy Analysis
RJ0200023_23
- Last Update 04/03/2025
- File Size 3.3MB
- # of Slides 2
- File Format PPTX
- Slide Ratio 16:9
- Color
Keywords
- #Content-Based Slides
- #Design-Based Slides
- #Business Strategy
- #Market and Competitor Analysis
- #Graph
- #Competitive Advantage
- #Column
- #Grouped Column
- #Project Progress
- #16:9
- #column chart PowerPoint
- #grouped bar graph presentation
- #dual series chart slide
- #business strategy analysis PPT
- #competitive analysis template
- #data comparison presentation slide
About the Product
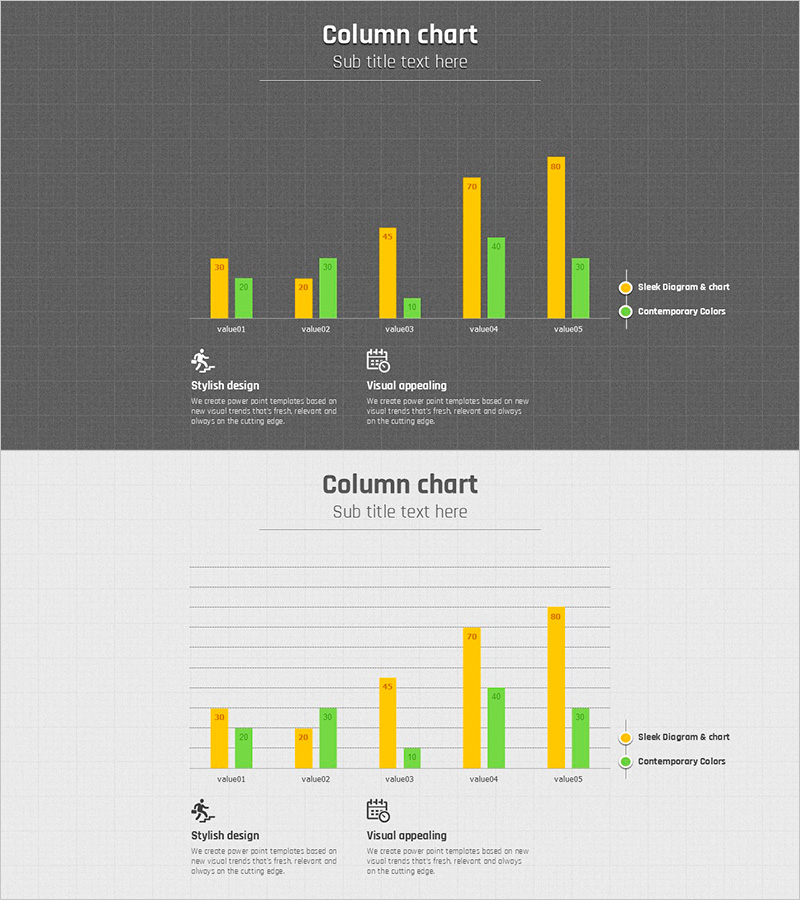
A grouped column chart PowerPoint slide featuring a dark gray background with plotting paper grid pattern. This presentation template displays 5 data items (value01 through value05) with dual series comparison in yellow and green colors, ideal for business strategy analysis, competitive landscape assessment, and market positioning. The 2-slide set includes both dark-tone and light-tone background versions, each with dedicated text sections for 'Stylish Design' and 'Visual Appealing' commentary. Delivered in 16:9 widescreen PPTX format with full editing capability for immediate customization.
Usage Points
-
Main Usage
Visualizes parallel comparison of two metrics across 5 data points to highlight numerical differences in business strategy, competitive positioning, and market analysis. Enables simultaneous representation of performance indicators, rankings, and benchmarks to strengthen decision-making evidence.
-
How to Use
Deploy the dark-tone slide for presentation opening and core analysis sections; use the light-tone version for detailed explanations and backup materials. Reference the legend (Sleek Diagram & chart / Contemporary Colors) to input data values and populate text areas with analytical insights.
-
Recommended For
Strategic planning teams, marketing departments, executive reports, investor pitch decks, business plans, and quarterly performance reviews. Recommended for competitive analysis, market share comparison, and KPI presentations in consulting, finance, manufacturing, and retail industries.
-
Slide Structure
2-slide composition: ① Dark gray background with grouped yellow-green columns (5 data items) + left icon area + right dual text boxes ② Light background version with identical chart structure. Plotting paper grid pattern applied throughout, 16:9 widescreen ratio, fully editable PPTX format.
Related Products
-

Analysis of Key Sections – Insights on Market and Competitors
#Market and Competitor Analysis #Graph #Competitor Analysis
-

Bundled Graphs and Maps for Business Plan Visualization
#Market and Competitor Analysis #Graph #Other
-

Business Analysis Chart – Visualizing Competitive Advantage
#Market and Competitor Analysis #Graph #Other
-

Marketing Performance and Analysis – Visualizing Results with Graphs
#Market and Competitor Analysis #Graph #Text Box
