Business Strategy Presentation Template with Doughnut Chart
RJ0200023_13
- Last Update 04/03/2025
- File Size 3.3MB
- # of Slides 2
- File Format PPTX
- Slide Ratio 16:9
- Color
Keywords
About the Product
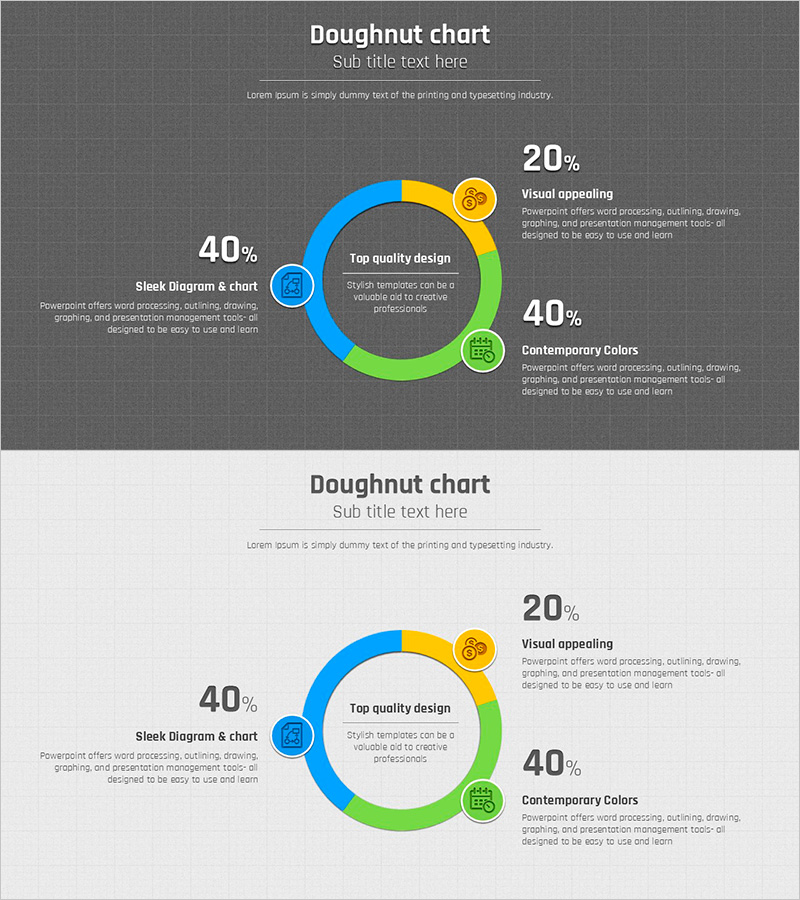
A doughnut chart PowerPoint slide designed to visualize business strategy initiatives and fund allocation plans. The slide features a dark gray background with four color segments—blue, yellow, and green—clearly representing the proportion of each category. Provided as a 2-slide set with identical layouts, each section includes circular icons and text areas for immediate use in presentations, business proposals, and strategy reports. Available in 16:9 widescreen PPTX format, fully editable in all modern PowerPoint versions.
Usage Points
-
Main Usage
Designed to display the proportional relationships of four business elements—strategy initiatives, fund allocation, budget distribution, and business components—at a glance. The center area of the doughnut allows placement of key messages to emphasize overall context.
-
How to Use
Replace segment text and percentages with your own data. Circular icons can be customized to represent category symbols, and colors can be adjusted to match corporate branding. Duplicate the 2-slide set to compare multiple scenarios or present different strategic options.
-
Recommended For
Ideal for business plans, investor pitch decks, executive reports, marketing strategy presentations, and business performance analysis. Recommended for finance teams, strategy departments, business development units, and marketing teams requiring data-driven decision-making materials.
-
Slide Structure
Both slides share identical layouts with a central doughnut chart divided into four color segments (blue 40%, yellow 20%, green 40%, and additional segments). Circular icons and text boxes are positioned around each segment for entering item names, percentages, and descriptions.
Related Products
-

Premium Management Template with Donut Chart for Performance Visualization
#Business Introduction #Business Strategy #Graph
-

Water Resources Donut Chart Presentation Template
#Business Strategy #Market and Competitor Analysis #Graph
-

Data Analysis Donut Circle Graph – Visual Representation for Market and Competitive Analysis
#Business Introduction #Market and Competitor Analysis #Graph
-

Donut Chart Comparison Slide | Data Visualization PPT
#Business Strategy #Market and Competitor Analysis #Graph
