Plotting Paper Presentation Template Diagram7 – Innovation in Visual Data Delivery
RJ0200023_28
- Last Update 04/03/2025
- File Size 3.3MB
- # of Slides 2
- File Format PPTX
- Slide Ratio 16:9
- Color
Keywords
- #Content-Based Slides
- #Design-Based Slides
- #Business Management
- #Graph
- #Project Organization and Roles and Responsibilities
- #Project Staffing
- #Circles
- #Pie Chart
- #16:9
- #circular diagram PowerPoint
- #4-segment pie chart slide
- #PowerPoint diagram template
- #data visualization slide
- #cycle diagram presentation
About the Product
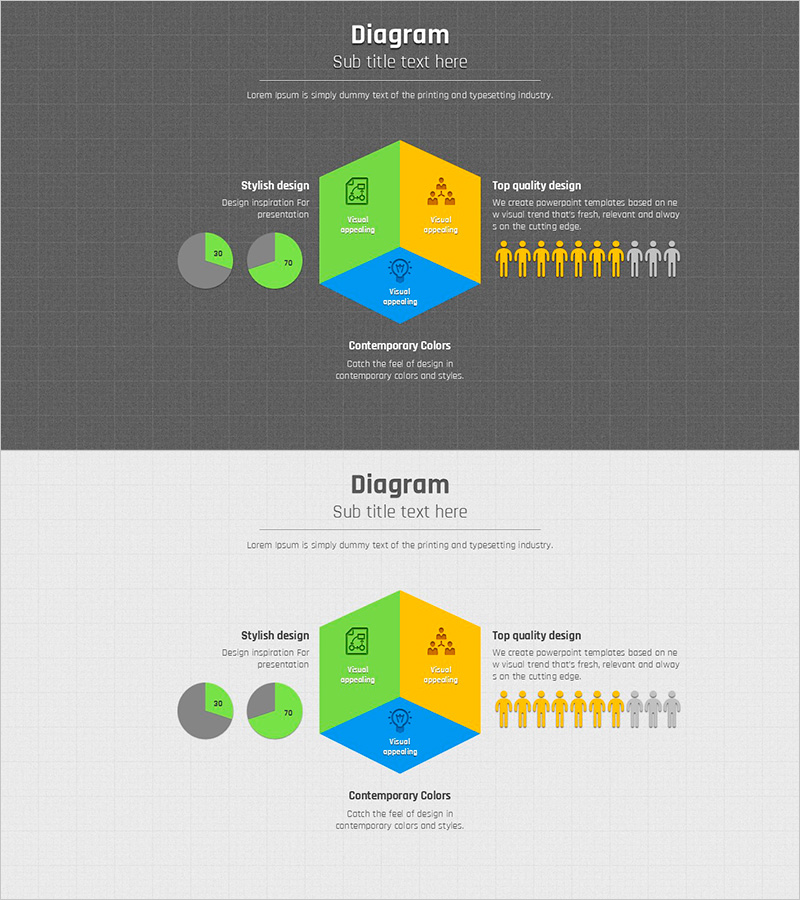
A 4-segment circular diagram PowerPoint slide template featuring distinct green, yellow, and blue color zones. The central diamond icon and surrounding text areas create a clear information hierarchy, while two pie charts on the left convey ratio data intuitively and human icons on the right represent target audiences. This PowerPoint slide set is ideal for business presentations, management reports, and data analysis documents where you need to explain core concepts across four stages or dimensions. The 2-slide package includes both dark and light background versions, allowing you to match your presentation's overall tone and style.
Usage Points
-
Main Usage
Displays the relationship, role, and proportion of four key elements simultaneously. Perfect for explaining business strategy's four core pillars, organizational structure across four departments, product development's four-phase process, or marketing's 4P framework with balanced visual representation.
-
How to Use
Enter your core concept in the central diamond shape, then distribute detailed content, metrics, and descriptions across the four segment areas. Use the left pie charts to represent ratio data and right human icons to indicate target groups, reinforcing the overall narrative. Choose between dark or light background versions to match your existing presentation materials.
-
Recommended For
Ideal for executives, strategists, and marketing professionals presenting business strategies, organizational structures, and processes. Recommended for investor presentations, business reports, strategic planning documents, and product introduction materials where balanced representation of key elements is essential.
-
Slide Structure
2-slide set featuring a central diamond-centered 4-segment circular diagram (green, yellow, blue, gray zones), two pie charts on the left (ratio display), and a row of human icons on the right (10-person representation). Both dark gray and light gray background versions are included for flexible presentation design.
Related Products
-

Simple Design Trend Wide PPT – Essential Tool for Business Management
#Business Management #Diagram #Project Organization and Roles and Responsibilities
-

Process Management Checklist Table – Efficient Task Allocation
#Business Management #Diagram #Project Organization and Roles and Responsibilities
-

Problem and Opportunity Analysis with Pie Charts
#Market and Competitor Analysis #Graph #Text Box
-

Toys and Pie Chart Analysis – Visual Data for Customer Insights
#Market and Competitor Analysis #Graph #Customer Analysis
