Graph and Column Charts Presentation Template
RJ0200023_10
- Last Update 04/03/2025
- File Size 3.8MB
- # of Slides 2
- File Format PPTX
- Slide Ratio 16:9
- Color
Keywords
About the Product
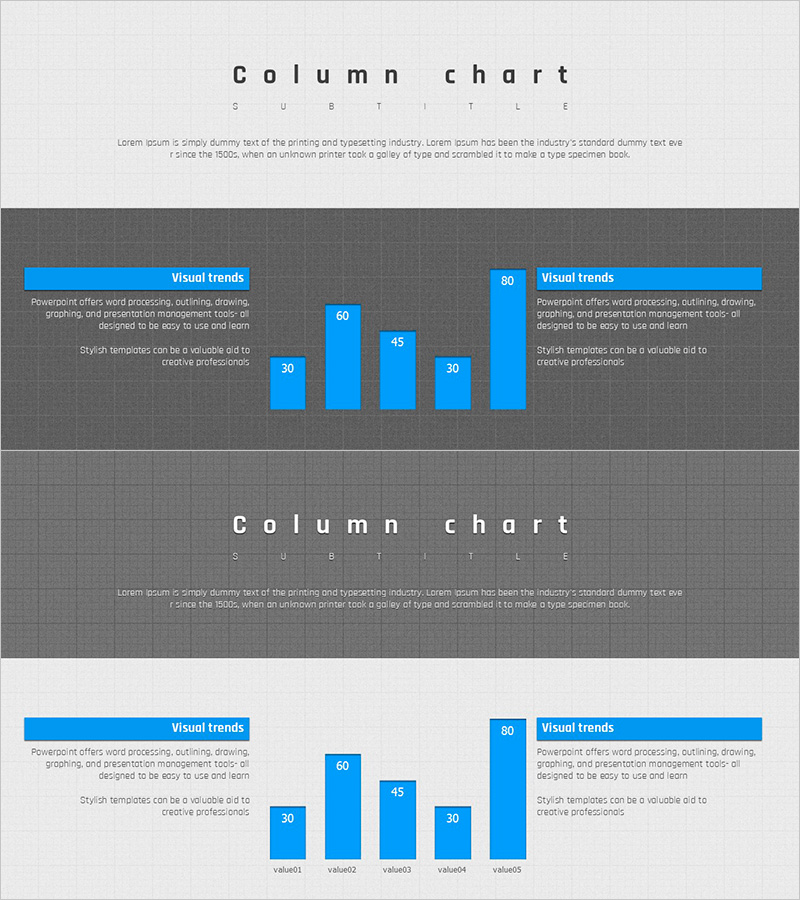
This free PowerPoint slide features five blue vertical bars arranged on a grid-patterned background, available in both dark gray and light gray versions. The two-column layout places the bar chart alongside a text description area, allowing you to present numerical data and its explanation side by side on a single slide. Each bar displays a value label, and item names can be entered below each column, making it easy to visualize comparative data in your presentation. This PPT slide is ready to insert into business plans, performance reports, marketing plans, or any deck that requires clear data comparison. The dual background options let you match the slide to your overall presentation style. For more graph and chart slide templates, explore the full collection at GoodPello.
Usage Points
-
Main Usage
Designed to visualize and compare up to five data points using a vertical bar chart format, making it suitable for presenting sales figures, performance metrics, or market share data in business presentations.
-
How to Use
Replace the numeric labels on each bar and the item names below (value01–value05) with your actual data, fill in the text description areas on both sides with your analysis, then choose between the dark or light grid background to match your slide deck.
-
Recommended For
Business planners, analysts, and marketers who need a clean, ready-to-use data comparison slide for reports, pitch decks, or performance presentations without building a chart layout from scratch.
-
Slide Structure
Single-slide layout with five blue vertical bars and dual-column text areas on left and right. Includes two background variants: dark gray grid and light gray grid, both in 16:9 ratio.
Related Products
-

Comparative Analysis Bar Graph – Market and Competitor Analysis
#Free Graphs
-

Data Visualization with Bar Charts – Presentation for Efficient Choices
#Free Graphs
-

Business Comparison Analysis Graph – Strengthening Market and Competitor Analysis
#Free Graphs
-

Tree Yellow Purple Area Chart – Innovation in Data Visualization
#Free Graphs
